By
Vlad Shvets
How Automotive Brands Get Into AI Car Recommendations
The hopeful story about AI search is that the old hierarchy does not carry over. In the car questions we ran it does. What moves as questions get specific is the shift from editorial verdicts to pricing and inventory data, and that is the way in.
The hopeful story about AI search is that the old hierarchy does not carry over. In the car questions we ran it does. What moves as questions get specific is the shift from editorial verdicts to pricing and inventory data, and that is the way in.
The hopeful story about AI search is that the old hierarchy does not carry over. In the car questions we ran it does. What moves as questions get specific is the shift from editorial verdicts to pricing and inventory data, and that is the way in.
Anyone marketing a car, a dealership, or an automotive site has been told the hopeful version of what AI search changes. The engines read passages rather than domains, the old hierarchy does not carry over, and a small specialist can land in an answer Google would never have ranked it for.
It is a good story, and it would be the cheapest visibility in the category if it were true. We went looking for it in the car questions buyers ask, on ChatGPT and Google AI Mode.
In automotive it is not there. Car and Driver alone appears in 36.59% of answers that cited any source when the question is a plain superlative, and 35.04% when the question is loaded with constraints. Nine of the eleven domains across the two leading groups are the same nine.
The short version, and it is smaller than the story but more use to you: as the question gets more specific, the answer shifts from editorial verdicts toward pricing and inventory data, without ever leaving the established set. That shift is the opening for a brand that is not Car and Driver.
What this can and cannot show, before the numbers. It records the sources that appeared beside these answers. It does not establish that a source caused a car to be recommended, and nothing here was built to test that.
The Long Tail Was Not There
We expected low-authority properties to out-appear the established outlets on long-tail questions. They do not, and not narrowly.
Across a targeted set of car-buying questions we ran on ChatGPT and Google AI Mode in August 2026, Car and Driver sits at the top of both halves. MotorTrend, Edmunds, KBB, Autoblog, and Cars.com fill out both leading groups behind it.
No unfamiliar property reaches the top of either half. The two leading groups are very nearly the same list, which is by far the tightest coupling of anything we measured this month.
The premise came from an earlier look at automotive domains, which had surfaced a set of unfamiliar sites collecting citations. Asked directly, in a fresh set of questions, none of that layer reached the leading group on either side.
That is worth holding next to what we have published about best-of listicles being the most cited content type we track. The format wins here too. Who gets to publish it does not appear to be up for grabs.
One row is excluded from everything below. Google AI Mode returns its citations as Google's own wrapper links instead of publisher URLs, so google.com sits near the top of both lists as engine plumbing rather than as a source.
Dropping it changes no other figure, and both halves carry the same mix of engines, so the two stay comparable against each other.
Before you plan around a small-site strategy in your own category, run your ten money questions and write down every domain that comes back. The answer differs by category, and ours came back with the incumbents.
Specificity Moves The Answer From Verdicts To Data
The two halves asked the same kind of question at two levels of detail. "Best compact SUVs" against "Top seven-seat hybrid family SUVs." "Best pickup trucks" against "Best used towing pickups."
A tracked query is that whole string, kept still, which is what makes the two halves comparable at all.
Car and Driver holds almost still across that shift. Everything under it rearranges, as shares of answers that cited any source, the plain questions first:
Car and Driver: 36.59% and 35.04%, the leading source in both halves.
KBB: 12.20% climbing to 17.95%.
iSeeCars: absent from the plain leading group, arriving at 17.09% when constraints are stacked.
MotorTrend: 17.07% falling to 13.68%.
Edmunds: 17.07% falling to 11.97%.
Cars.com and Autoblog: both edging up, 8.94% to 11.97% and 9.76% to 11.11%.
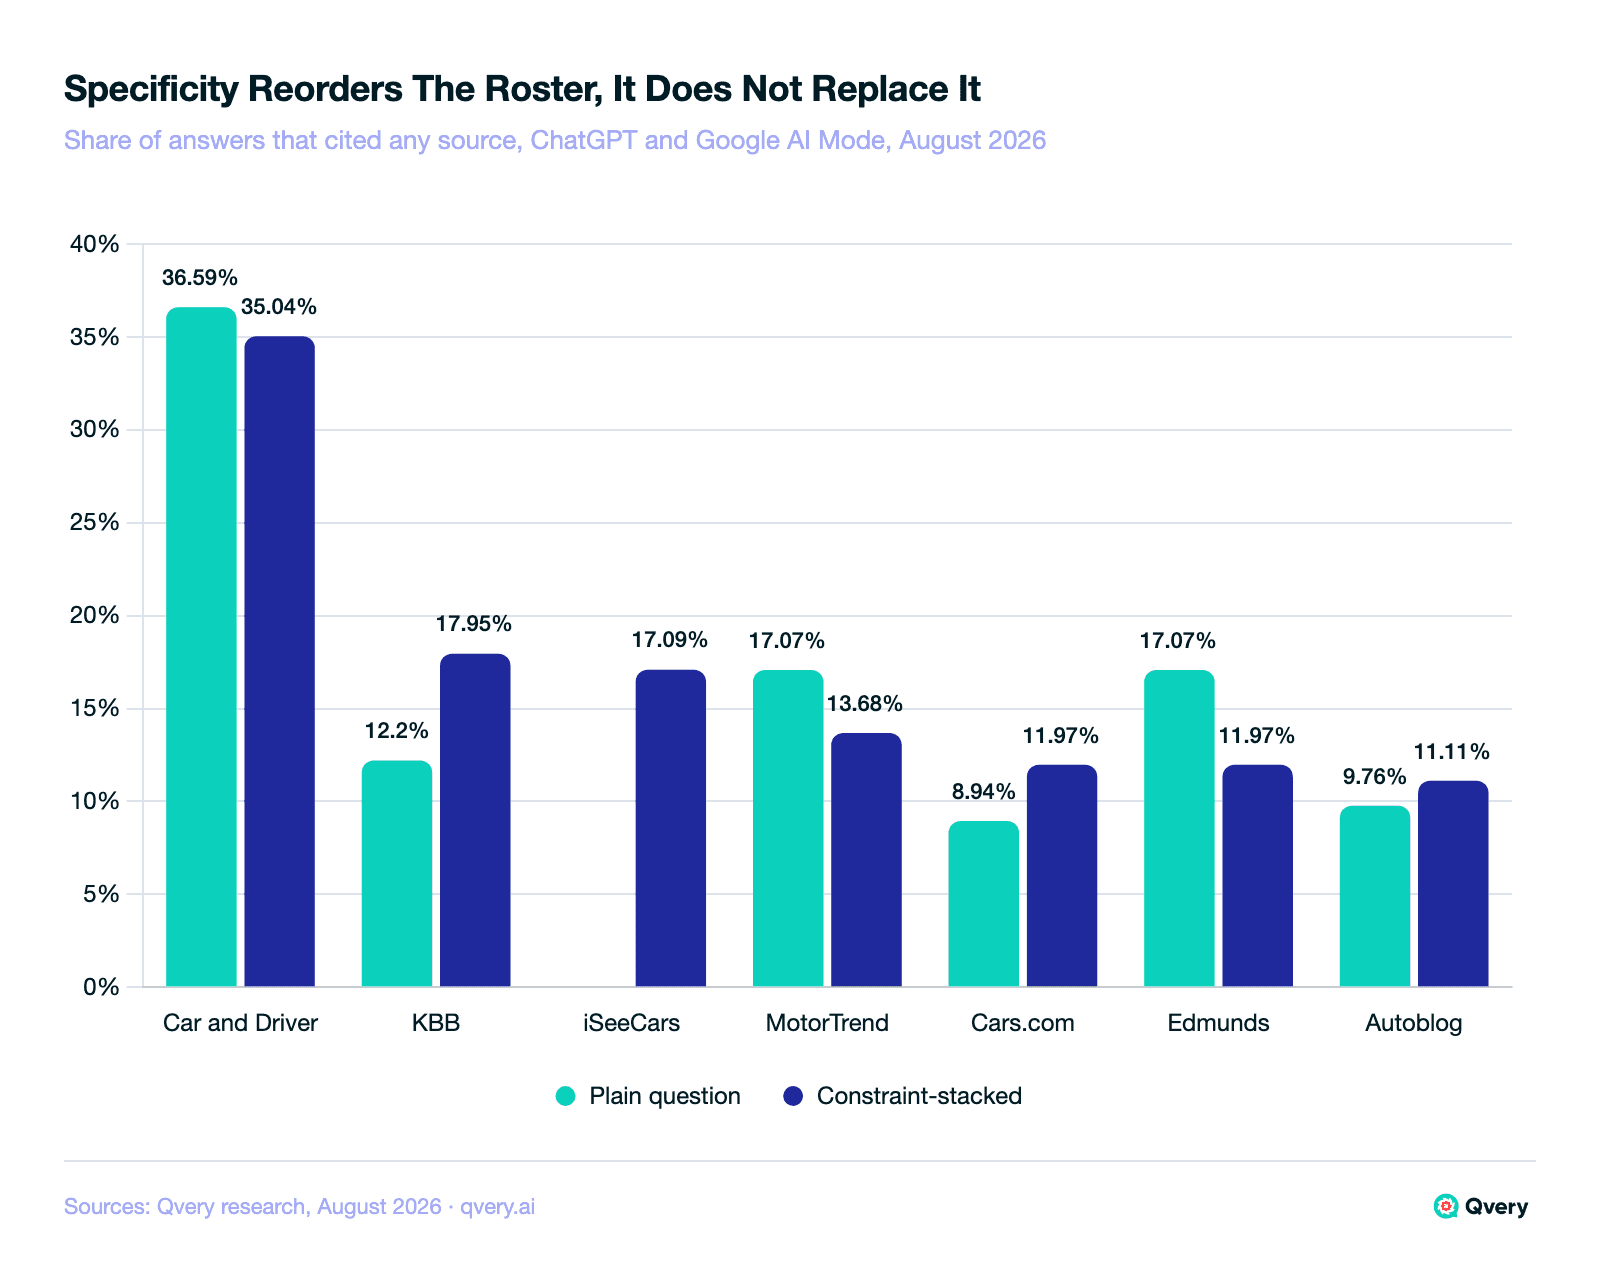
The two properties that rise are pricing and inventory data. The three that fall are editorial review titles.
That is the finding, and it is a smaller one than the brief wanted, though it points somewhere a marketer can act.
KBB and iSeeCars publish the same kind of thing: prices, depreciation curves, inventory, and the filters that let a reader narrow by them. Underneath both is a database with pages, and a database answers a constrained question without anybody writing a new article.
A plain superlative wants a verdict. Somebody has to have driven the cars and formed an opinion, and that is what an editorial title sells.
A constrained question wants a filter on a dataset: seven seats, hybrid, used, under a price, in the snow.
None of that is a claim about how the engines work inside. It describes what the two kinds of question ask for, and which properties publish that kind of thing.
We had expected constrained questions to push citations outside the established roster. They did not. The shift happened inside it, from one kind of established property to another.
For every constraint your buyers bring, check whether your specs and pricing are correct in the two data properties rather than only in the editorial reviews. Those are different submission processes owned by different teams.
Constraints Cost The Engine Some Of Its Confidence
One more thing moved, and it is the cleanest number here.
Ask a plain question and 98.40% of the time the answer cites a source. Load it with constraints and that falls to 93.60%.
That is a share of all the answers rather than of the ones that cited something, so it is a different denominator from every percentage above and does not belong in a sentence with them.
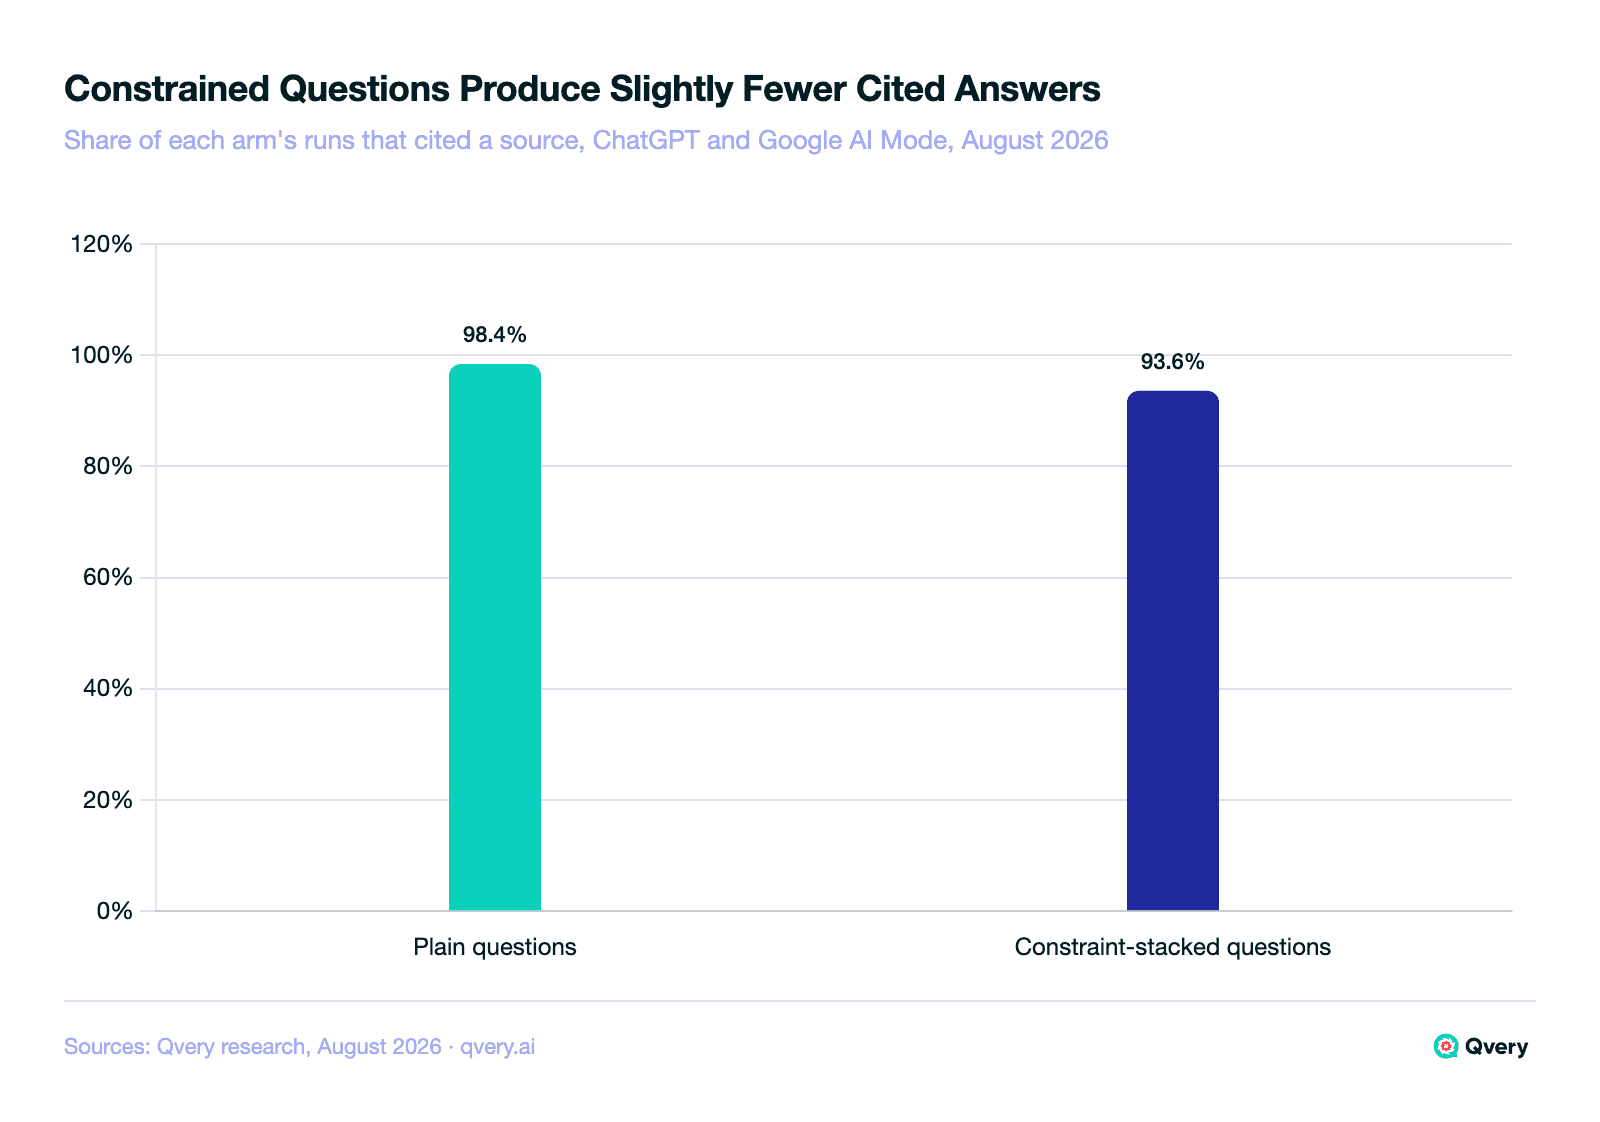
The gap is 4.8 points, which is modest and worth stating precisely instead of dressing up. The large majority of constrained questions still produced a cited answer.
A stack of constraints makes an engine marginally more likely to answer without reaching for a source at all. Fewer of those questions produced a citation, which means fewer of them produced an opportunity for anybody to be cited.
Operationally that means the constrained half of your query set will carry slightly more blanks, and a blank is not a loss. On those answers nobody was cited, including your competitors.
The questions that came back with nothing cited are the only part of this category where Car and Driver has no head start.
Keep a list of the constrained questions that came back with no cited source. Those are the questions nothing in your market answers well enough yet, and they are the cheapest content briefs you will write this quarter.
Why We Are Not Naming A Low-Authority Bucket
An obvious way to report this article would be a chart splitting citations into established and low-authority properties, with a headline about how small the second bucket turned out to be.
We are not doing that, and the reason matters more than the result.
We never wrote down a list of low-authority automotive domains before we looked. "Established" and "low-authority" here are read off the roster we observed, after the fact.
Defining that bucket now, having already seen that we found nothing in it, is exactly the after-the-fact line-drawing our own research rules ban. It would let us choose a boundary that produced a satisfying number.
So this is a weaker null than it would have been with a list written in advance. We can say the leading groups on both sides are made of well-known automotive publishers and data properties, and we can say no unfamiliar domain reached them.
We cannot put a percentage on a category we invented afterwards.
There is a second reason to refuse. A bucket drawn after the data has been seen is unfalsifiable in a specific way: the next analyst draws the boundary somewhere else and gets a different number, and neither of you can be shown wrong.
When a study tells you a class of sites is winning or losing, ask when that class was defined. Before the data or after it is the whole question, and it is rarely stated.
What This Means If You Are Not Car And Driver
Everything from here is judgment on what the pattern suggests. The numbers show what appeared alongside these answers. They do not show that changing any of it changes what gets cited.
The reachable layer in this data is the data layer. Getting a vehicle's specifications, pricing, and inventory correct and current inside the properties that publish that data is a different job from pitching an editorial reviewer, and it has a shorter feedback loop.
An editorial verdict is somebody's opinion, and you cannot supply it. A spec table is a fact, and you can.
Our own earlier automotive work found that manufacturer channels are largely absent from their own category, and nothing here contradicts it.
What it adds is that the properties standing between a brand and the answer are the ones everybody already knows. That is bad news for a challenger site and reasonably good news for a brand with real data to supply.
What we would not do on this evidence is start a content farm. The premise we went in with, that an unknown site can accumulate automotive citations at the rate an established one does, is the thing we went looking for and failed to find.
The travel comparison is worth keeping in view, because it is why we looked. The travel category does carry a content-farm layer that automotive appears to lack.
Two categories, two different answers, which is the argument for measuring your own rather than importing somebody else's finding.
There is an obvious objection to all of this, which is that we asked one set of questions in one month. That is fair, and it is the reason the recommendation is to run your own rather than to act on ours. What travels between categories is the method, not the roster.
Which properties carry you is a read off the citation list, ranked by weight rather than by reputation.
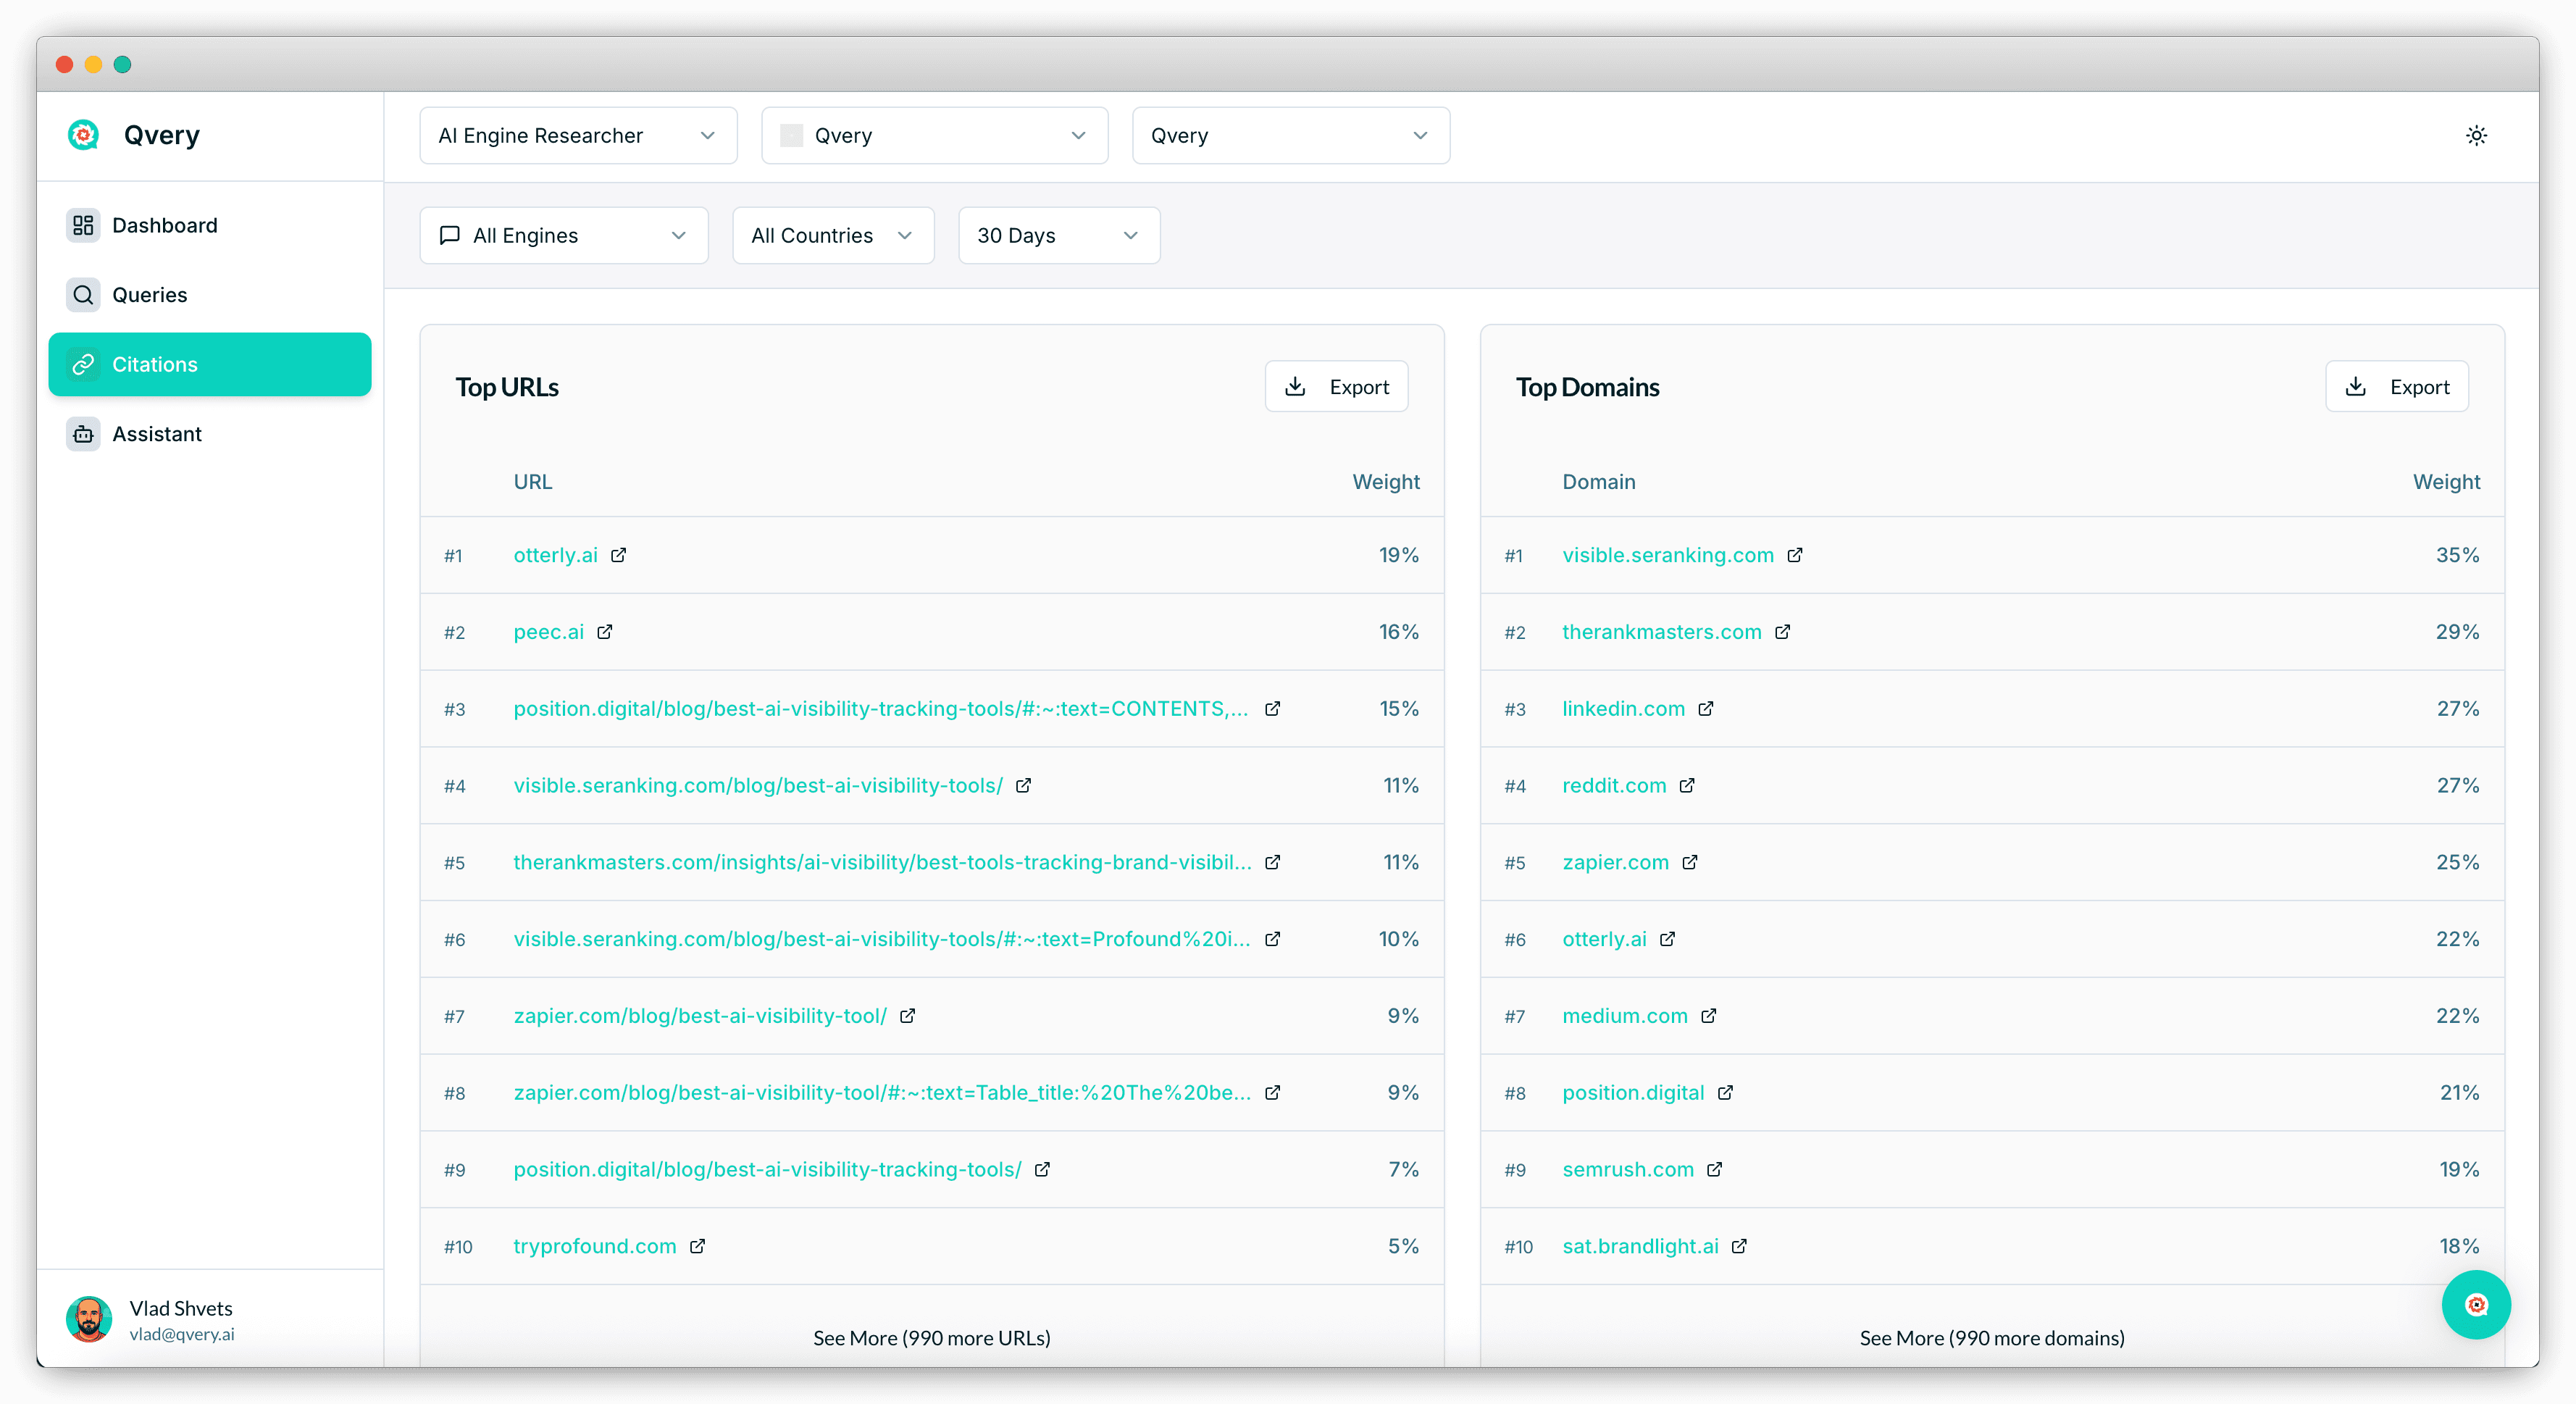
The account in that view is not an automotive brand, and the ranked-weight read is the part that transfers.
Pick the one data property that covers your segment and audit your own listings inside it this month. Specifications, trim-level pricing, and availability, checked against what you sell today.
Tag Your Queries By Specificity In Qvery Before You Track Them
Two lists again, though the split here is by specificity rather than by audience:
The plain list: your category and body-style terms, nothing else on the line.
The constrained list: the same terms with the real filters hung off them, meaning seats, drivetrain, budget, used or new, and the weather people drive in.
Set them up as two topics and let them run. Qvery asks them daily on ChatGPT and Google AI Mode, in over 200 countries, and captures every citation tied to the query and the engine that produced it.
Tag every tracked query by specificity when you create it, because retrofitting that tag onto a live query set is tedious and everyone puts it off.
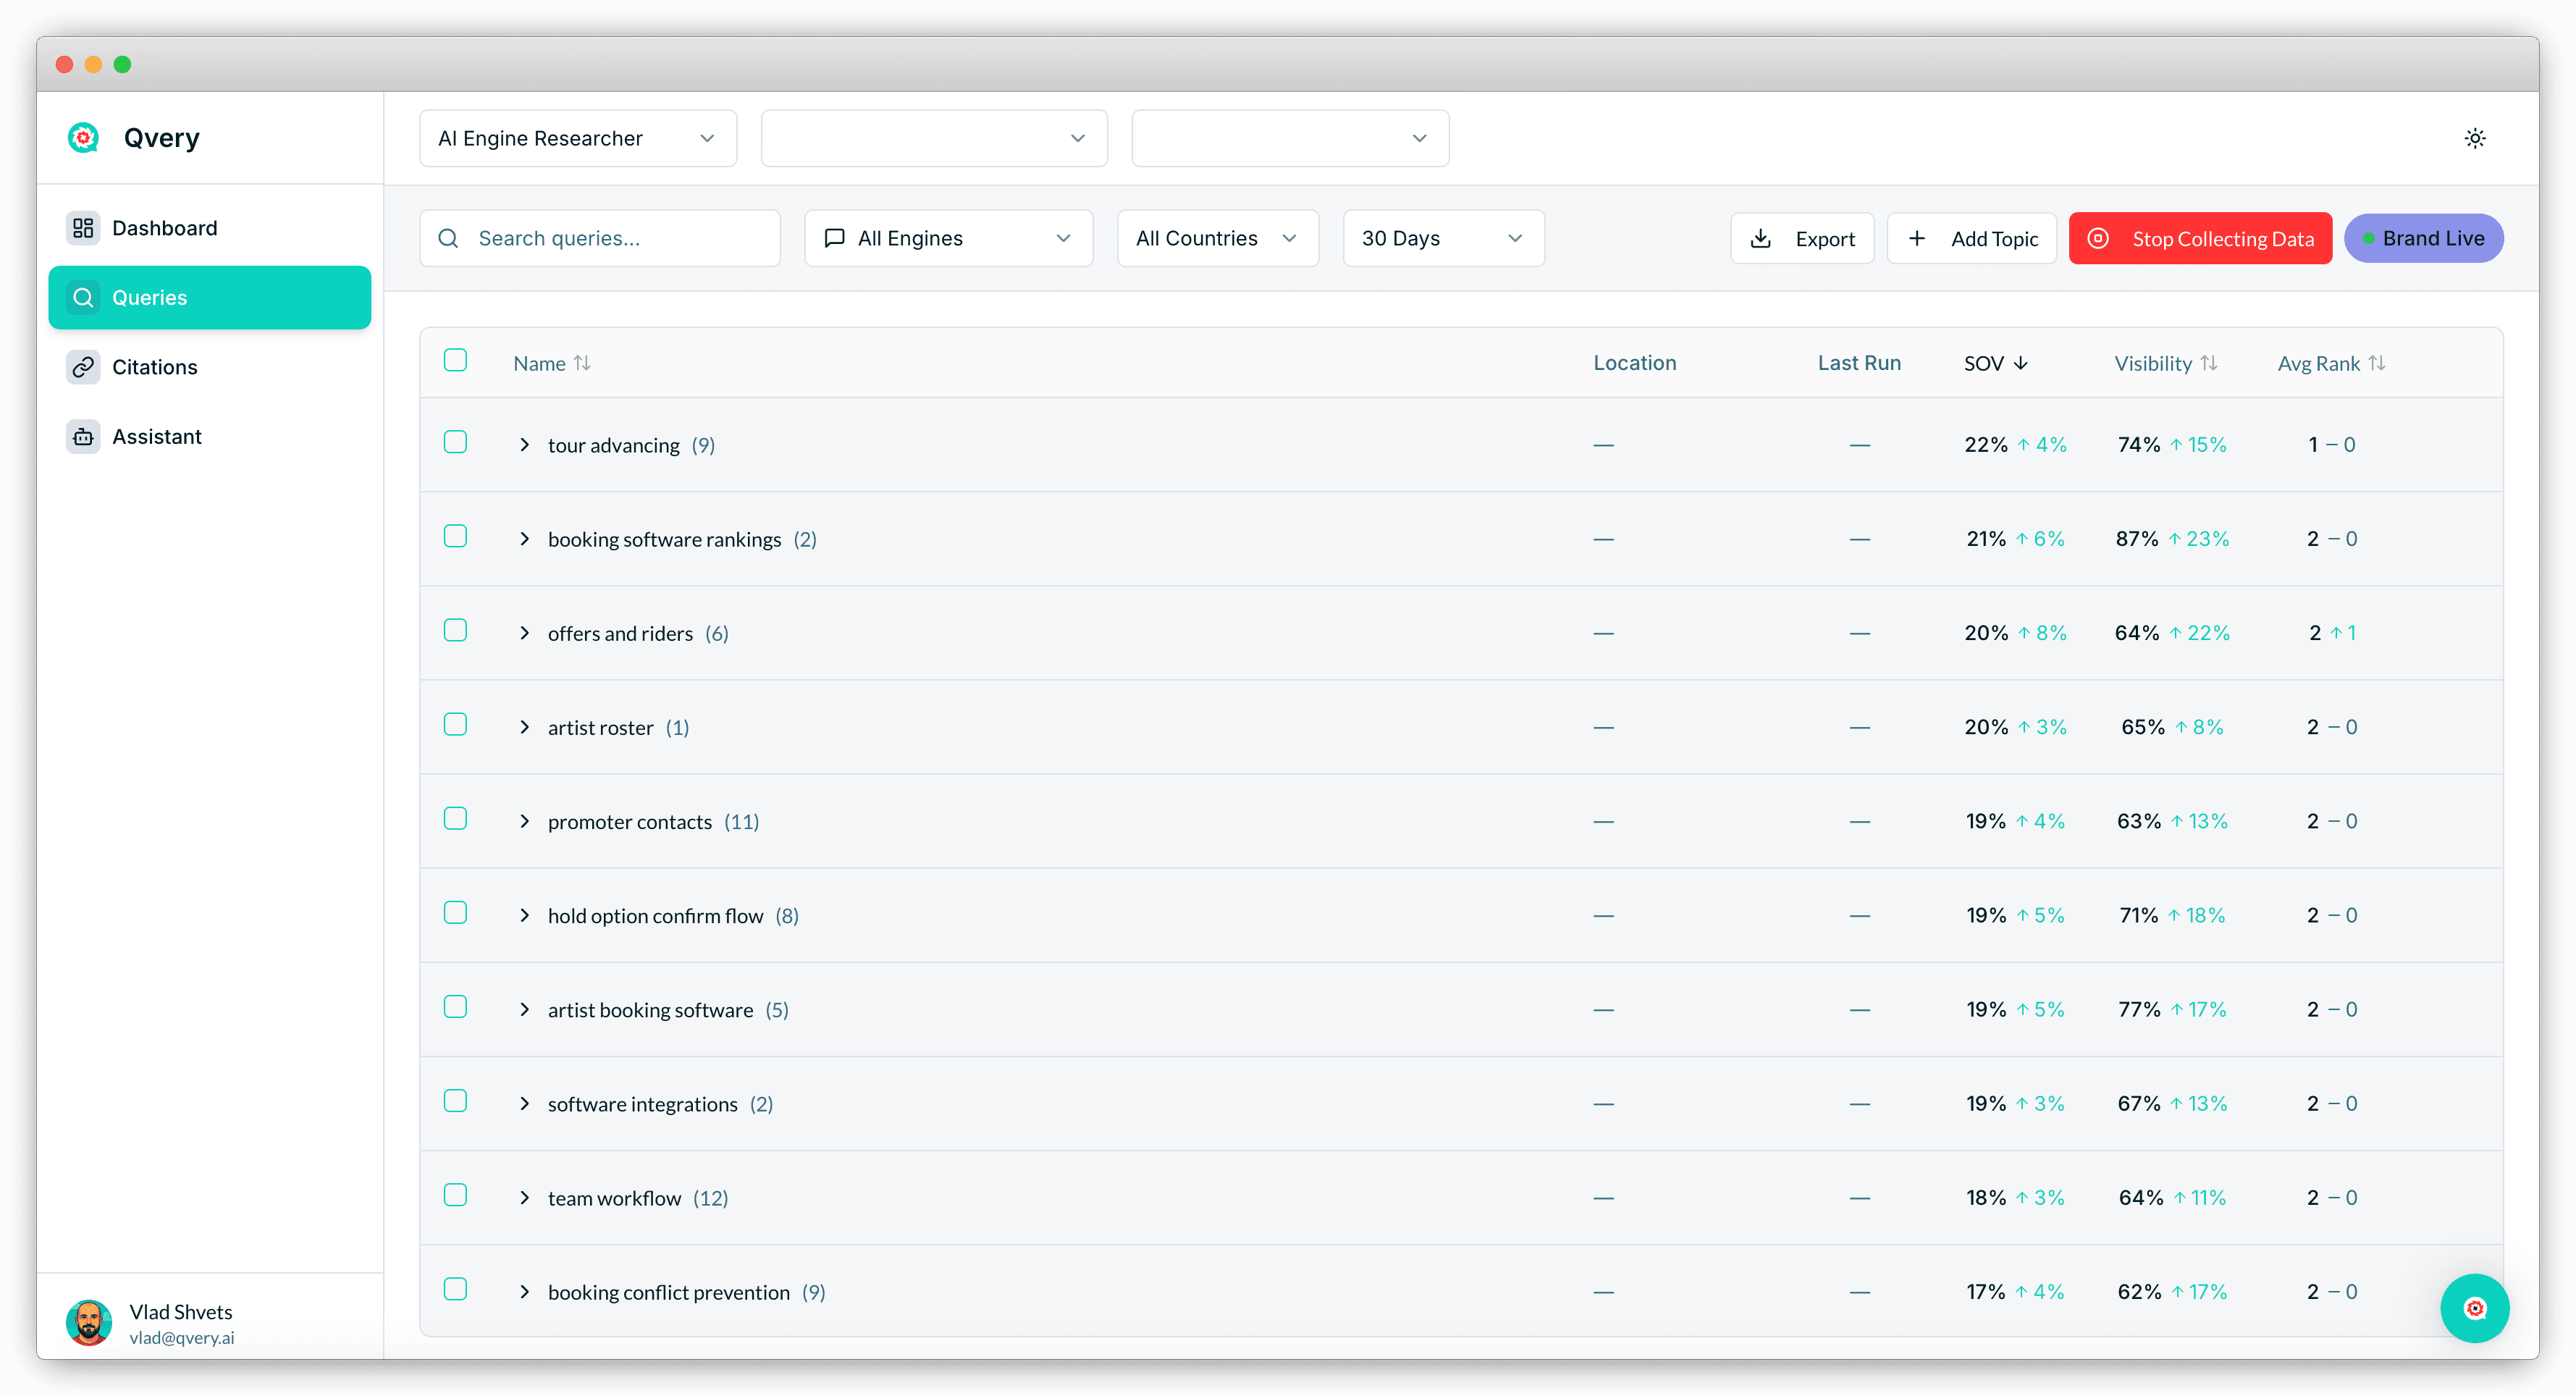
Then read the two topic groups apart from each other:
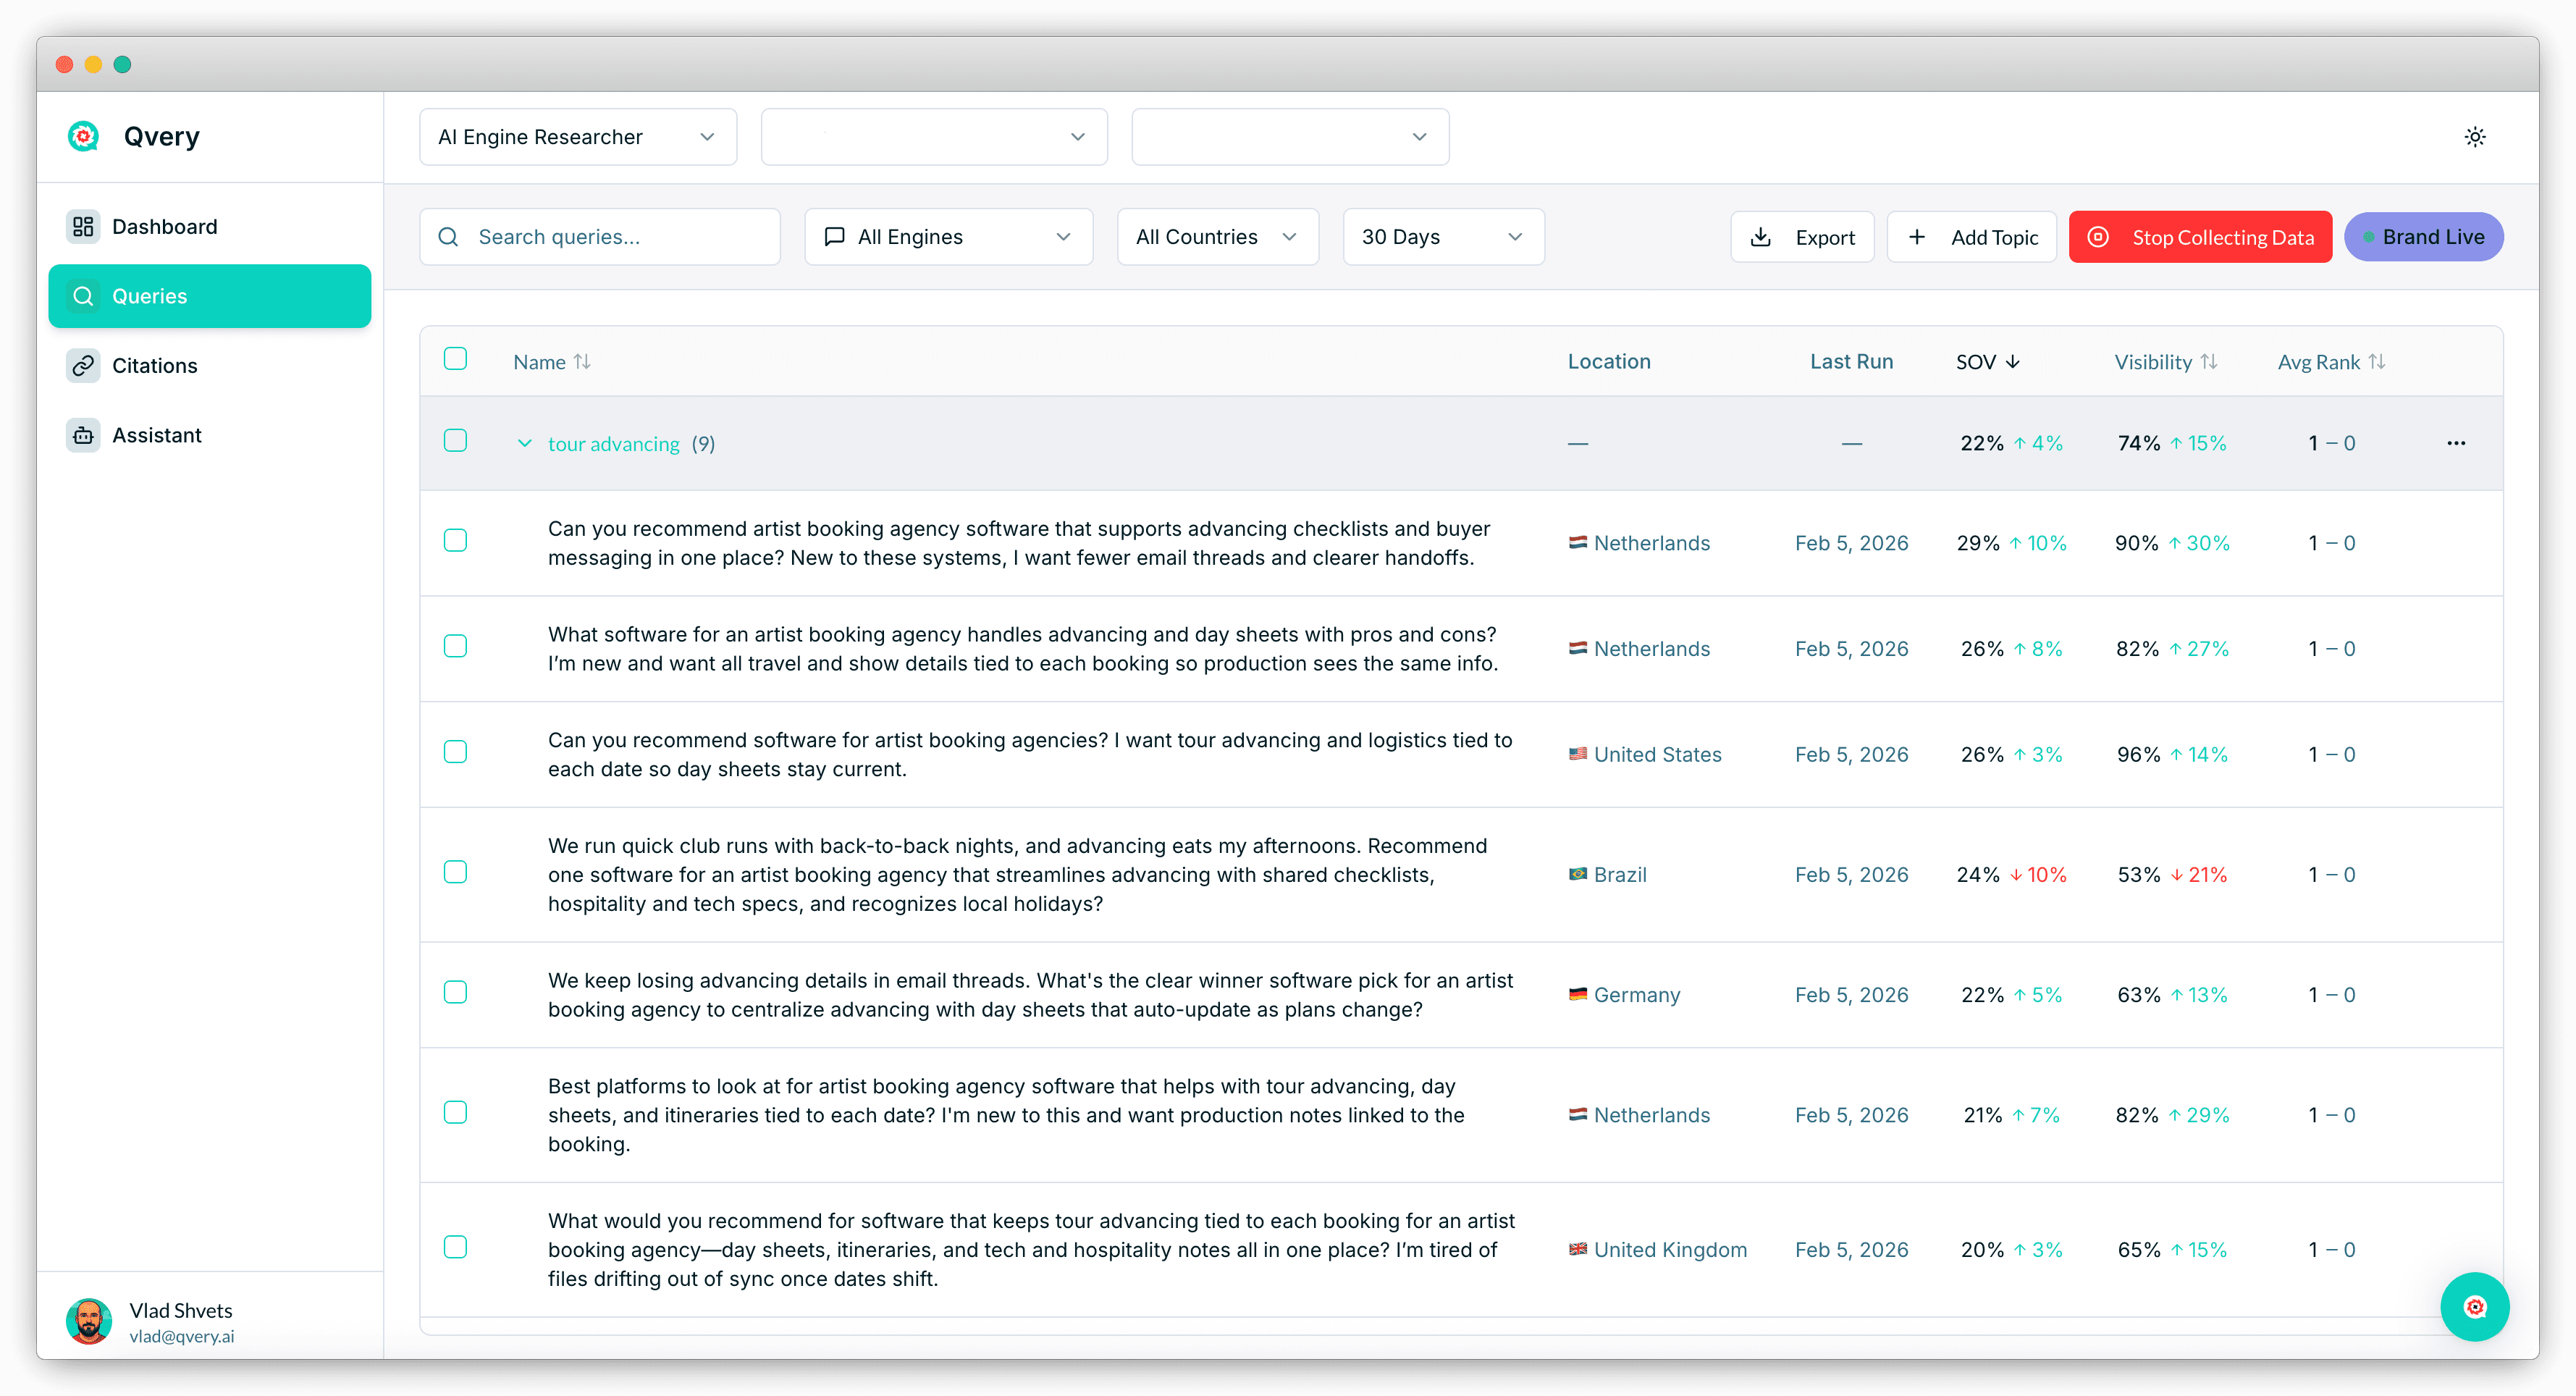
Visibility per topic: whether you are named at all on each shape of question.
Top Domains per topic: editorial on one, data properties on the other, which tells you which team owns the fix.
The queries with no citation: your list of unanswered constrained questions.
The delta: whether the constrained topic moves after you correct your listings.
In Qvery Assistant you ask for the same cut in plain language, and the shipped templates include a citation audit, which is the shape of the roster work above.
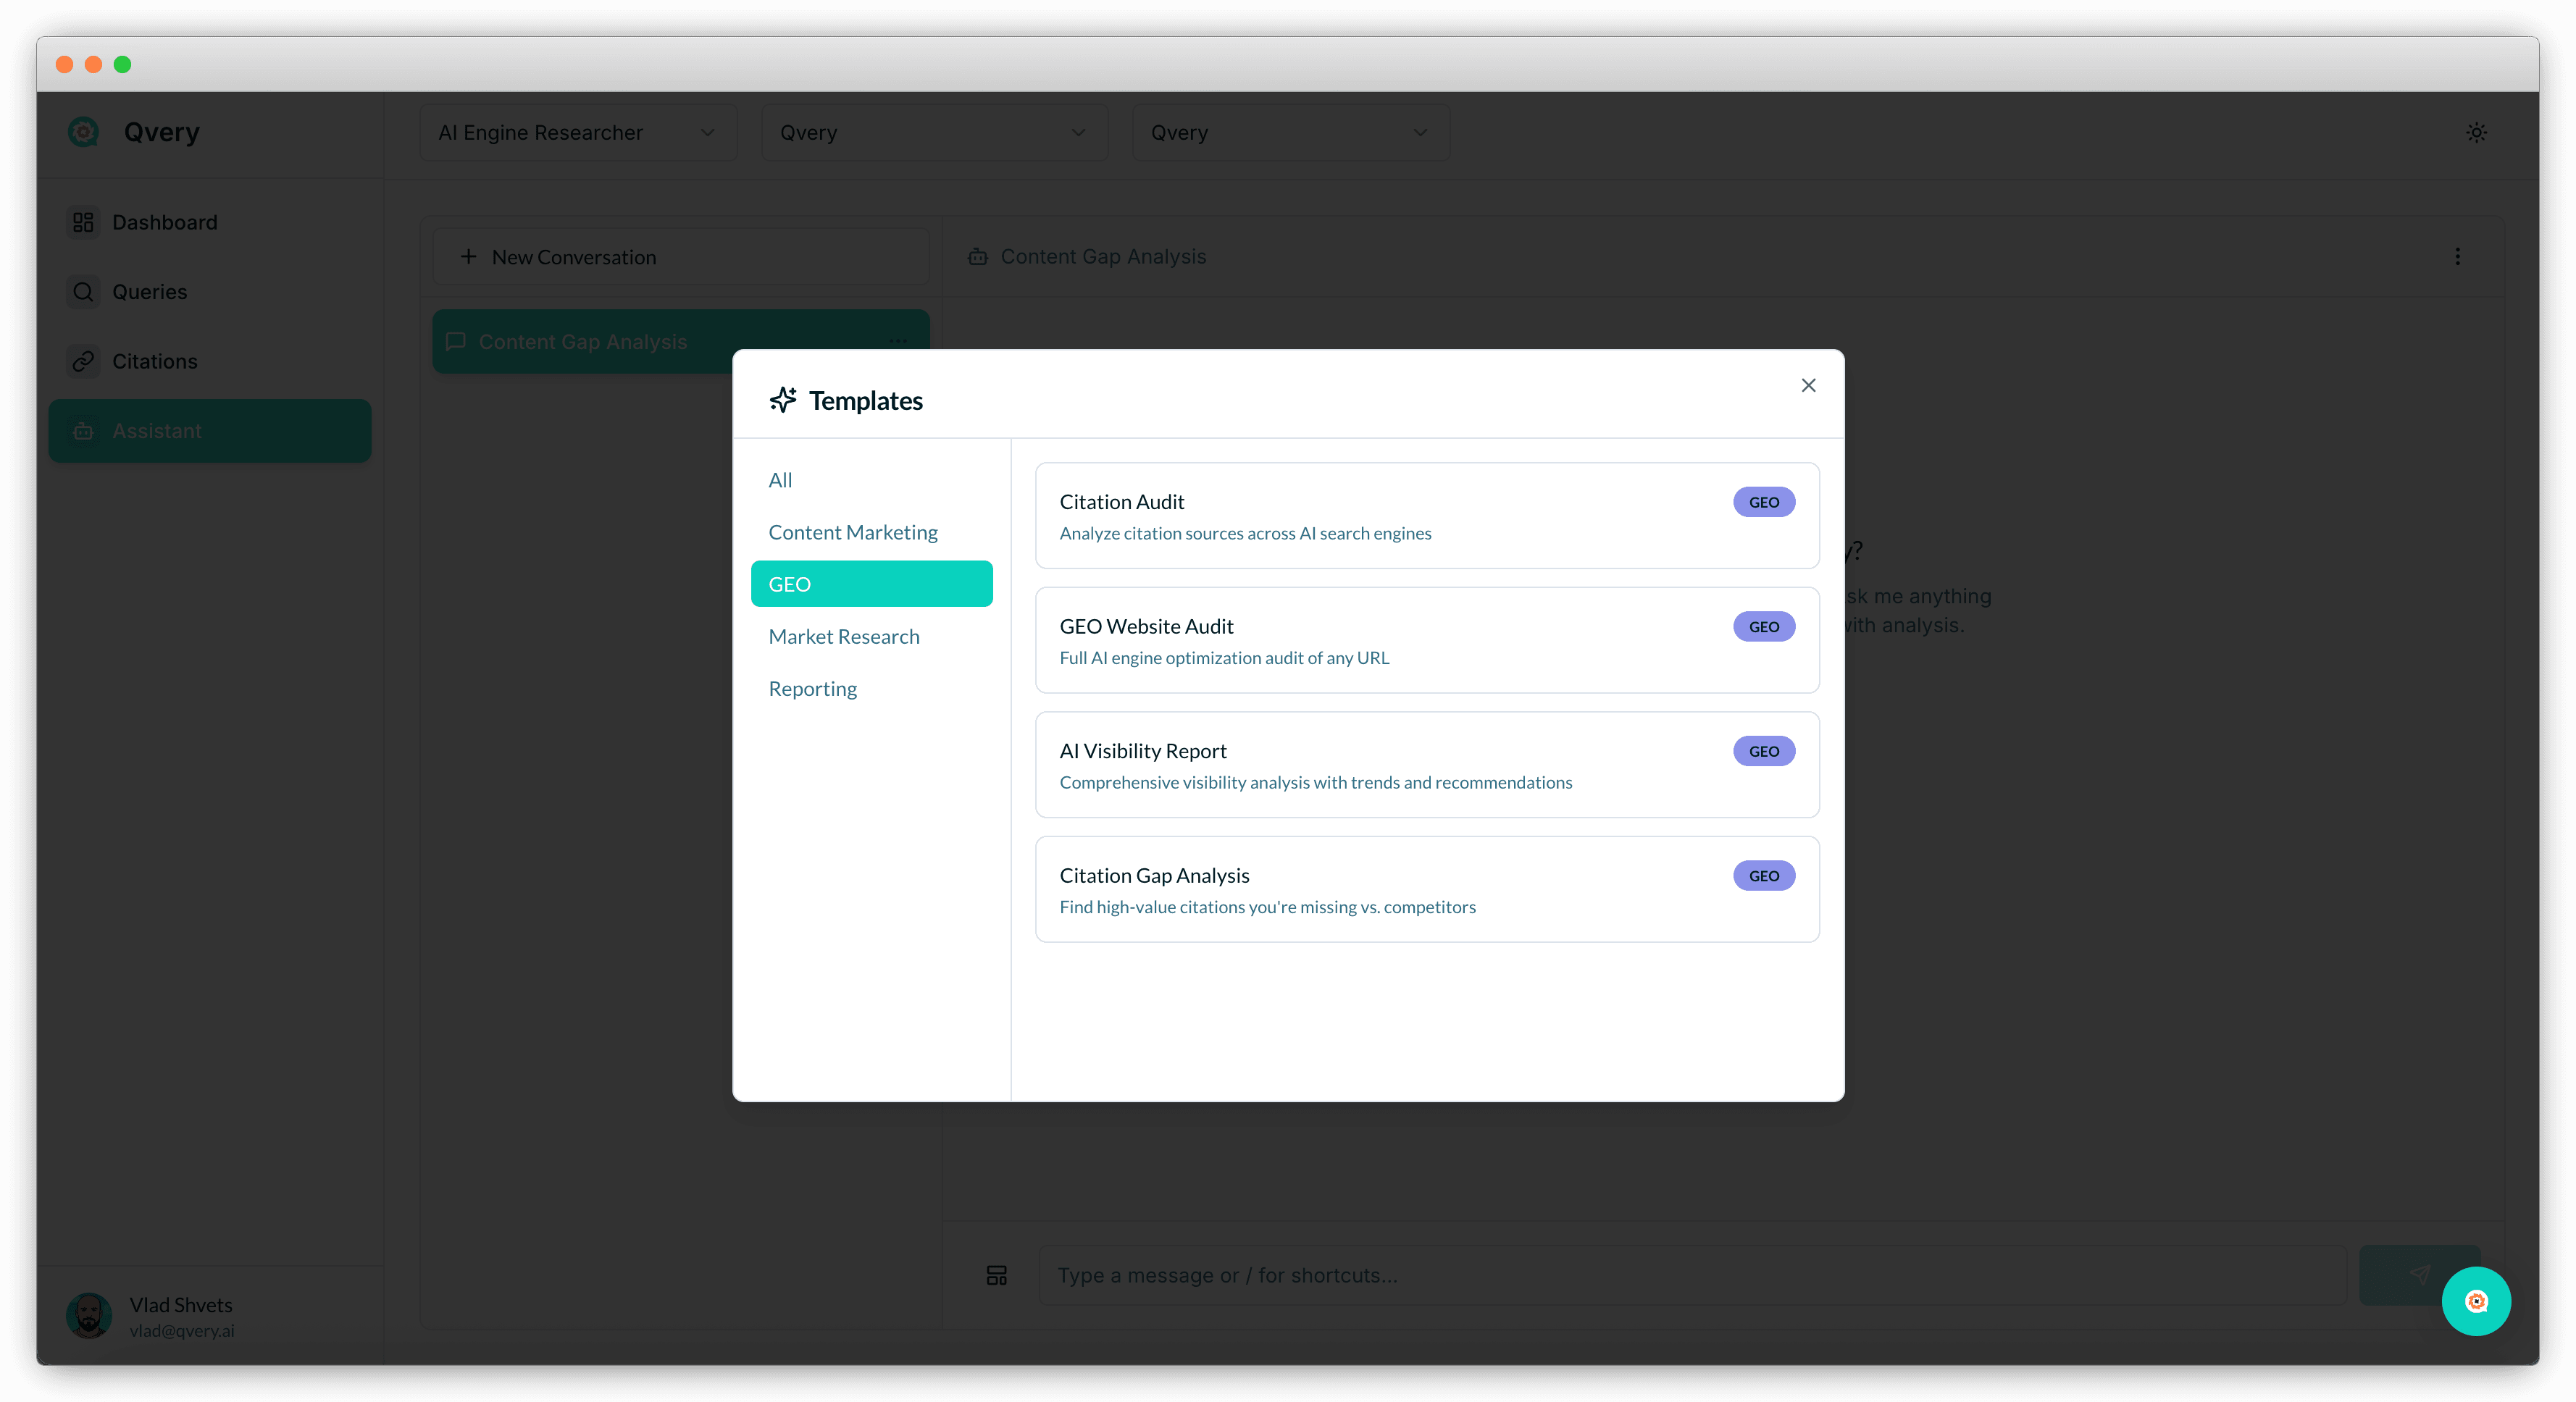
Two things stay yours. Deciding whether a cited domain is editorial or data is a judgment call on a list of URLs, and Qvery captures the list rather than sorting it.
And it will not tell you a property is worth supplying data to. It will tell you whether that property is in your answers, which is the input to that decision.
If you take one thing from this article, make it the tagging. Everything else here follows from being able to read the two groups apart, and nothing else here works without that.
Start your free trial and tag your first month of automotive queries by how specific they are.
If the plain questions and the constrained ones return the same publishers in a different order, you are looking at what we found, and the work is in the order rather than in the list.
Anyone marketing a car, a dealership, or an automotive site has been told the hopeful version of what AI search changes. The engines read passages rather than domains, the old hierarchy does not carry over, and a small specialist can land in an answer Google would never have ranked it for.
It is a good story, and it would be the cheapest visibility in the category if it were true. We went looking for it in the car questions buyers ask, on ChatGPT and Google AI Mode.
In automotive it is not there. Car and Driver alone appears in 36.59% of answers that cited any source when the question is a plain superlative, and 35.04% when the question is loaded with constraints. Nine of the eleven domains across the two leading groups are the same nine.
The short version, and it is smaller than the story but more use to you: as the question gets more specific, the answer shifts from editorial verdicts toward pricing and inventory data, without ever leaving the established set. That shift is the opening for a brand that is not Car and Driver.
What this can and cannot show, before the numbers. It records the sources that appeared beside these answers. It does not establish that a source caused a car to be recommended, and nothing here was built to test that.
The Long Tail Was Not There
We expected low-authority properties to out-appear the established outlets on long-tail questions. They do not, and not narrowly.
Across a targeted set of car-buying questions we ran on ChatGPT and Google AI Mode in August 2026, Car and Driver sits at the top of both halves. MotorTrend, Edmunds, KBB, Autoblog, and Cars.com fill out both leading groups behind it.
No unfamiliar property reaches the top of either half. The two leading groups are very nearly the same list, which is by far the tightest coupling of anything we measured this month.
The premise came from an earlier look at automotive domains, which had surfaced a set of unfamiliar sites collecting citations. Asked directly, in a fresh set of questions, none of that layer reached the leading group on either side.
That is worth holding next to what we have published about best-of listicles being the most cited content type we track. The format wins here too. Who gets to publish it does not appear to be up for grabs.
One row is excluded from everything below. Google AI Mode returns its citations as Google's own wrapper links instead of publisher URLs, so google.com sits near the top of both lists as engine plumbing rather than as a source.
Dropping it changes no other figure, and both halves carry the same mix of engines, so the two stay comparable against each other.
Before you plan around a small-site strategy in your own category, run your ten money questions and write down every domain that comes back. The answer differs by category, and ours came back with the incumbents.
Specificity Moves The Answer From Verdicts To Data
The two halves asked the same kind of question at two levels of detail. "Best compact SUVs" against "Top seven-seat hybrid family SUVs." "Best pickup trucks" against "Best used towing pickups."
A tracked query is that whole string, kept still, which is what makes the two halves comparable at all.
Car and Driver holds almost still across that shift. Everything under it rearranges, as shares of answers that cited any source, the plain questions first:
Car and Driver: 36.59% and 35.04%, the leading source in both halves.
KBB: 12.20% climbing to 17.95%.
iSeeCars: absent from the plain leading group, arriving at 17.09% when constraints are stacked.
MotorTrend: 17.07% falling to 13.68%.
Edmunds: 17.07% falling to 11.97%.
Cars.com and Autoblog: both edging up, 8.94% to 11.97% and 9.76% to 11.11%.
The two properties that rise are pricing and inventory data. The three that fall are editorial review titles.
That is the finding, and it is a smaller one than the brief wanted, though it points somewhere a marketer can act.
KBB and iSeeCars publish the same kind of thing: prices, depreciation curves, inventory, and the filters that let a reader narrow by them. Underneath both is a database with pages, and a database answers a constrained question without anybody writing a new article.
A plain superlative wants a verdict. Somebody has to have driven the cars and formed an opinion, and that is what an editorial title sells.
A constrained question wants a filter on a dataset: seven seats, hybrid, used, under a price, in the snow.
None of that is a claim about how the engines work inside. It describes what the two kinds of question ask for, and which properties publish that kind of thing.
We had expected constrained questions to push citations outside the established roster. They did not. The shift happened inside it, from one kind of established property to another.
For every constraint your buyers bring, check whether your specs and pricing are correct in the two data properties rather than only in the editorial reviews. Those are different submission processes owned by different teams.
Constraints Cost The Engine Some Of Its Confidence
One more thing moved, and it is the cleanest number here.
Ask a plain question and 98.40% of the time the answer cites a source. Load it with constraints and that falls to 93.60%.
That is a share of all the answers rather than of the ones that cited something, so it is a different denominator from every percentage above and does not belong in a sentence with them.
The gap is 4.8 points, which is modest and worth stating precisely instead of dressing up. The large majority of constrained questions still produced a cited answer.
A stack of constraints makes an engine marginally more likely to answer without reaching for a source at all. Fewer of those questions produced a citation, which means fewer of them produced an opportunity for anybody to be cited.
Operationally that means the constrained half of your query set will carry slightly more blanks, and a blank is not a loss. On those answers nobody was cited, including your competitors.
The questions that came back with nothing cited are the only part of this category where Car and Driver has no head start.
Keep a list of the constrained questions that came back with no cited source. Those are the questions nothing in your market answers well enough yet, and they are the cheapest content briefs you will write this quarter.
Why We Are Not Naming A Low-Authority Bucket
An obvious way to report this article would be a chart splitting citations into established and low-authority properties, with a headline about how small the second bucket turned out to be.
We are not doing that, and the reason matters more than the result.
We never wrote down a list of low-authority automotive domains before we looked. "Established" and "low-authority" here are read off the roster we observed, after the fact.
Defining that bucket now, having already seen that we found nothing in it, is exactly the after-the-fact line-drawing our own research rules ban. It would let us choose a boundary that produced a satisfying number.
So this is a weaker null than it would have been with a list written in advance. We can say the leading groups on both sides are made of well-known automotive publishers and data properties, and we can say no unfamiliar domain reached them.
We cannot put a percentage on a category we invented afterwards.
There is a second reason to refuse. A bucket drawn after the data has been seen is unfalsifiable in a specific way: the next analyst draws the boundary somewhere else and gets a different number, and neither of you can be shown wrong.
When a study tells you a class of sites is winning or losing, ask when that class was defined. Before the data or after it is the whole question, and it is rarely stated.
What This Means If You Are Not Car And Driver
Everything from here is judgment on what the pattern suggests. The numbers show what appeared alongside these answers. They do not show that changing any of it changes what gets cited.
The reachable layer in this data is the data layer. Getting a vehicle's specifications, pricing, and inventory correct and current inside the properties that publish that data is a different job from pitching an editorial reviewer, and it has a shorter feedback loop.
An editorial verdict is somebody's opinion, and you cannot supply it. A spec table is a fact, and you can.
Our own earlier automotive work found that manufacturer channels are largely absent from their own category, and nothing here contradicts it.
What it adds is that the properties standing between a brand and the answer are the ones everybody already knows. That is bad news for a challenger site and reasonably good news for a brand with real data to supply.
What we would not do on this evidence is start a content farm. The premise we went in with, that an unknown site can accumulate automotive citations at the rate an established one does, is the thing we went looking for and failed to find.
The travel comparison is worth keeping in view, because it is why we looked. The travel category does carry a content-farm layer that automotive appears to lack.
Two categories, two different answers, which is the argument for measuring your own rather than importing somebody else's finding.
There is an obvious objection to all of this, which is that we asked one set of questions in one month. That is fair, and it is the reason the recommendation is to run your own rather than to act on ours. What travels between categories is the method, not the roster.
Which properties carry you is a read off the citation list, ranked by weight rather than by reputation.
The account in that view is not an automotive brand, and the ranked-weight read is the part that transfers.
Pick the one data property that covers your segment and audit your own listings inside it this month. Specifications, trim-level pricing, and availability, checked against what you sell today.
Tag Your Queries By Specificity In Qvery Before You Track Them
Two lists again, though the split here is by specificity rather than by audience:
The plain list: your category and body-style terms, nothing else on the line.
The constrained list: the same terms with the real filters hung off them, meaning seats, drivetrain, budget, used or new, and the weather people drive in.
Set them up as two topics and let them run. Qvery asks them daily on ChatGPT and Google AI Mode, in over 200 countries, and captures every citation tied to the query and the engine that produced it.
Tag every tracked query by specificity when you create it, because retrofitting that tag onto a live query set is tedious and everyone puts it off.
Then read the two topic groups apart from each other:
Visibility per topic: whether you are named at all on each shape of question.
Top Domains per topic: editorial on one, data properties on the other, which tells you which team owns the fix.
The queries with no citation: your list of unanswered constrained questions.
The delta: whether the constrained topic moves after you correct your listings.
In Qvery Assistant you ask for the same cut in plain language, and the shipped templates include a citation audit, which is the shape of the roster work above.
Two things stay yours. Deciding whether a cited domain is editorial or data is a judgment call on a list of URLs, and Qvery captures the list rather than sorting it.
And it will not tell you a property is worth supplying data to. It will tell you whether that property is in your answers, which is the input to that decision.
If you take one thing from this article, make it the tagging. Everything else here follows from being able to read the two groups apart, and nothing else here works without that.
Start your free trial and tag your first month of automotive queries by how specific they are.
If the plain questions and the constrained ones return the same publishers in a different order, you are looking at what we found, and the work is in the order rather than in the list.
Anyone marketing a car, a dealership, or an automotive site has been told the hopeful version of what AI search changes. The engines read passages rather than domains, the old hierarchy does not carry over, and a small specialist can land in an answer Google would never have ranked it for.
It is a good story, and it would be the cheapest visibility in the category if it were true. We went looking for it in the car questions buyers ask, on ChatGPT and Google AI Mode.
In automotive it is not there. Car and Driver alone appears in 36.59% of answers that cited any source when the question is a plain superlative, and 35.04% when the question is loaded with constraints. Nine of the eleven domains across the two leading groups are the same nine.
The short version, and it is smaller than the story but more use to you: as the question gets more specific, the answer shifts from editorial verdicts toward pricing and inventory data, without ever leaving the established set. That shift is the opening for a brand that is not Car and Driver.
What this can and cannot show, before the numbers. It records the sources that appeared beside these answers. It does not establish that a source caused a car to be recommended, and nothing here was built to test that.
The Long Tail Was Not There
We expected low-authority properties to out-appear the established outlets on long-tail questions. They do not, and not narrowly.
Across a targeted set of car-buying questions we ran on ChatGPT and Google AI Mode in August 2026, Car and Driver sits at the top of both halves. MotorTrend, Edmunds, KBB, Autoblog, and Cars.com fill out both leading groups behind it.
No unfamiliar property reaches the top of either half. The two leading groups are very nearly the same list, which is by far the tightest coupling of anything we measured this month.
The premise came from an earlier look at automotive domains, which had surfaced a set of unfamiliar sites collecting citations. Asked directly, in a fresh set of questions, none of that layer reached the leading group on either side.
That is worth holding next to what we have published about best-of listicles being the most cited content type we track. The format wins here too. Who gets to publish it does not appear to be up for grabs.
One row is excluded from everything below. Google AI Mode returns its citations as Google's own wrapper links instead of publisher URLs, so google.com sits near the top of both lists as engine plumbing rather than as a source.
Dropping it changes no other figure, and both halves carry the same mix of engines, so the two stay comparable against each other.
Before you plan around a small-site strategy in your own category, run your ten money questions and write down every domain that comes back. The answer differs by category, and ours came back with the incumbents.
Specificity Moves The Answer From Verdicts To Data
The two halves asked the same kind of question at two levels of detail. "Best compact SUVs" against "Top seven-seat hybrid family SUVs." "Best pickup trucks" against "Best used towing pickups."
A tracked query is that whole string, kept still, which is what makes the two halves comparable at all.
Car and Driver holds almost still across that shift. Everything under it rearranges, as shares of answers that cited any source, the plain questions first:
Car and Driver: 36.59% and 35.04%, the leading source in both halves.
KBB: 12.20% climbing to 17.95%.
iSeeCars: absent from the plain leading group, arriving at 17.09% when constraints are stacked.
MotorTrend: 17.07% falling to 13.68%.
Edmunds: 17.07% falling to 11.97%.
Cars.com and Autoblog: both edging up, 8.94% to 11.97% and 9.76% to 11.11%.
The two properties that rise are pricing and inventory data. The three that fall are editorial review titles.
That is the finding, and it is a smaller one than the brief wanted, though it points somewhere a marketer can act.
KBB and iSeeCars publish the same kind of thing: prices, depreciation curves, inventory, and the filters that let a reader narrow by them. Underneath both is a database with pages, and a database answers a constrained question without anybody writing a new article.
A plain superlative wants a verdict. Somebody has to have driven the cars and formed an opinion, and that is what an editorial title sells.
A constrained question wants a filter on a dataset: seven seats, hybrid, used, under a price, in the snow.
None of that is a claim about how the engines work inside. It describes what the two kinds of question ask for, and which properties publish that kind of thing.
We had expected constrained questions to push citations outside the established roster. They did not. The shift happened inside it, from one kind of established property to another.
For every constraint your buyers bring, check whether your specs and pricing are correct in the two data properties rather than only in the editorial reviews. Those are different submission processes owned by different teams.
Constraints Cost The Engine Some Of Its Confidence
One more thing moved, and it is the cleanest number here.
Ask a plain question and 98.40% of the time the answer cites a source. Load it with constraints and that falls to 93.60%.
That is a share of all the answers rather than of the ones that cited something, so it is a different denominator from every percentage above and does not belong in a sentence with them.
The gap is 4.8 points, which is modest and worth stating precisely instead of dressing up. The large majority of constrained questions still produced a cited answer.
A stack of constraints makes an engine marginally more likely to answer without reaching for a source at all. Fewer of those questions produced a citation, which means fewer of them produced an opportunity for anybody to be cited.
Operationally that means the constrained half of your query set will carry slightly more blanks, and a blank is not a loss. On those answers nobody was cited, including your competitors.
The questions that came back with nothing cited are the only part of this category where Car and Driver has no head start.
Keep a list of the constrained questions that came back with no cited source. Those are the questions nothing in your market answers well enough yet, and they are the cheapest content briefs you will write this quarter.
Why We Are Not Naming A Low-Authority Bucket
An obvious way to report this article would be a chart splitting citations into established and low-authority properties, with a headline about how small the second bucket turned out to be.
We are not doing that, and the reason matters more than the result.
We never wrote down a list of low-authority automotive domains before we looked. "Established" and "low-authority" here are read off the roster we observed, after the fact.
Defining that bucket now, having already seen that we found nothing in it, is exactly the after-the-fact line-drawing our own research rules ban. It would let us choose a boundary that produced a satisfying number.
So this is a weaker null than it would have been with a list written in advance. We can say the leading groups on both sides are made of well-known automotive publishers and data properties, and we can say no unfamiliar domain reached them.
We cannot put a percentage on a category we invented afterwards.
There is a second reason to refuse. A bucket drawn after the data has been seen is unfalsifiable in a specific way: the next analyst draws the boundary somewhere else and gets a different number, and neither of you can be shown wrong.
When a study tells you a class of sites is winning or losing, ask when that class was defined. Before the data or after it is the whole question, and it is rarely stated.
What This Means If You Are Not Car And Driver
Everything from here is judgment on what the pattern suggests. The numbers show what appeared alongside these answers. They do not show that changing any of it changes what gets cited.
The reachable layer in this data is the data layer. Getting a vehicle's specifications, pricing, and inventory correct and current inside the properties that publish that data is a different job from pitching an editorial reviewer, and it has a shorter feedback loop.
An editorial verdict is somebody's opinion, and you cannot supply it. A spec table is a fact, and you can.
Our own earlier automotive work found that manufacturer channels are largely absent from their own category, and nothing here contradicts it.
What it adds is that the properties standing between a brand and the answer are the ones everybody already knows. That is bad news for a challenger site and reasonably good news for a brand with real data to supply.
What we would not do on this evidence is start a content farm. The premise we went in with, that an unknown site can accumulate automotive citations at the rate an established one does, is the thing we went looking for and failed to find.
The travel comparison is worth keeping in view, because it is why we looked. The travel category does carry a content-farm layer that automotive appears to lack.
Two categories, two different answers, which is the argument for measuring your own rather than importing somebody else's finding.
There is an obvious objection to all of this, which is that we asked one set of questions in one month. That is fair, and it is the reason the recommendation is to run your own rather than to act on ours. What travels between categories is the method, not the roster.
Which properties carry you is a read off the citation list, ranked by weight rather than by reputation.
The account in that view is not an automotive brand, and the ranked-weight read is the part that transfers.
Pick the one data property that covers your segment and audit your own listings inside it this month. Specifications, trim-level pricing, and availability, checked against what you sell today.
Tag Your Queries By Specificity In Qvery Before You Track Them
Two lists again, though the split here is by specificity rather than by audience:
The plain list: your category and body-style terms, nothing else on the line.
The constrained list: the same terms with the real filters hung off them, meaning seats, drivetrain, budget, used or new, and the weather people drive in.
Set them up as two topics and let them run. Qvery asks them daily on ChatGPT and Google AI Mode, in over 200 countries, and captures every citation tied to the query and the engine that produced it.
Tag every tracked query by specificity when you create it, because retrofitting that tag onto a live query set is tedious and everyone puts it off.
Then read the two topic groups apart from each other:
Visibility per topic: whether you are named at all on each shape of question.
Top Domains per topic: editorial on one, data properties on the other, which tells you which team owns the fix.
The queries with no citation: your list of unanswered constrained questions.
The delta: whether the constrained topic moves after you correct your listings.
In Qvery Assistant you ask for the same cut in plain language, and the shipped templates include a citation audit, which is the shape of the roster work above.
Two things stay yours. Deciding whether a cited domain is editorial or data is a judgment call on a list of URLs, and Qvery captures the list rather than sorting it.
And it will not tell you a property is worth supplying data to. It will tell you whether that property is in your answers, which is the input to that decision.
If you take one thing from this article, make it the tagging. Everything else here follows from being able to read the two groups apart, and nothing else here works without that.
Start your free trial and tag your first month of automotive queries by how specific they are.
If the plain questions and the constrained ones return the same publishers in a different order, you are looking at what we found, and the work is in the order rather than in the list.
Anyone marketing a car, a dealership, or an automotive site has been told the hopeful version of what AI search changes. The engines read passages rather than domains, the old hierarchy does not carry over, and a small specialist can land in an answer Google would never have ranked it for.
It is a good story, and it would be the cheapest visibility in the category if it were true. We went looking for it in the car questions buyers ask, on ChatGPT and Google AI Mode.
In automotive it is not there. Car and Driver alone appears in 36.59% of answers that cited any source when the question is a plain superlative, and 35.04% when the question is loaded with constraints. Nine of the eleven domains across the two leading groups are the same nine.
The short version, and it is smaller than the story but more use to you: as the question gets more specific, the answer shifts from editorial verdicts toward pricing and inventory data, without ever leaving the established set. That shift is the opening for a brand that is not Car and Driver.
What this can and cannot show, before the numbers. It records the sources that appeared beside these answers. It does not establish that a source caused a car to be recommended, and nothing here was built to test that.
The Long Tail Was Not There
We expected low-authority properties to out-appear the established outlets on long-tail questions. They do not, and not narrowly.
Across a targeted set of car-buying questions we ran on ChatGPT and Google AI Mode in August 2026, Car and Driver sits at the top of both halves. MotorTrend, Edmunds, KBB, Autoblog, and Cars.com fill out both leading groups behind it.
No unfamiliar property reaches the top of either half. The two leading groups are very nearly the same list, which is by far the tightest coupling of anything we measured this month.
The premise came from an earlier look at automotive domains, which had surfaced a set of unfamiliar sites collecting citations. Asked directly, in a fresh set of questions, none of that layer reached the leading group on either side.
That is worth holding next to what we have published about best-of listicles being the most cited content type we track. The format wins here too. Who gets to publish it does not appear to be up for grabs.
One row is excluded from everything below. Google AI Mode returns its citations as Google's own wrapper links instead of publisher URLs, so google.com sits near the top of both lists as engine plumbing rather than as a source.
Dropping it changes no other figure, and both halves carry the same mix of engines, so the two stay comparable against each other.
Before you plan around a small-site strategy in your own category, run your ten money questions and write down every domain that comes back. The answer differs by category, and ours came back with the incumbents.
Specificity Moves The Answer From Verdicts To Data
The two halves asked the same kind of question at two levels of detail. "Best compact SUVs" against "Top seven-seat hybrid family SUVs." "Best pickup trucks" against "Best used towing pickups."
A tracked query is that whole string, kept still, which is what makes the two halves comparable at all.
Car and Driver holds almost still across that shift. Everything under it rearranges, as shares of answers that cited any source, the plain questions first:
Car and Driver: 36.59% and 35.04%, the leading source in both halves.
KBB: 12.20% climbing to 17.95%.
iSeeCars: absent from the plain leading group, arriving at 17.09% when constraints are stacked.
MotorTrend: 17.07% falling to 13.68%.
Edmunds: 17.07% falling to 11.97%.
Cars.com and Autoblog: both edging up, 8.94% to 11.97% and 9.76% to 11.11%.
The two properties that rise are pricing and inventory data. The three that fall are editorial review titles.
That is the finding, and it is a smaller one than the brief wanted, though it points somewhere a marketer can act.
KBB and iSeeCars publish the same kind of thing: prices, depreciation curves, inventory, and the filters that let a reader narrow by them. Underneath both is a database with pages, and a database answers a constrained question without anybody writing a new article.
A plain superlative wants a verdict. Somebody has to have driven the cars and formed an opinion, and that is what an editorial title sells.
A constrained question wants a filter on a dataset: seven seats, hybrid, used, under a price, in the snow.
None of that is a claim about how the engines work inside. It describes what the two kinds of question ask for, and which properties publish that kind of thing.
We had expected constrained questions to push citations outside the established roster. They did not. The shift happened inside it, from one kind of established property to another.
For every constraint your buyers bring, check whether your specs and pricing are correct in the two data properties rather than only in the editorial reviews. Those are different submission processes owned by different teams.
Constraints Cost The Engine Some Of Its Confidence
One more thing moved, and it is the cleanest number here.
Ask a plain question and 98.40% of the time the answer cites a source. Load it with constraints and that falls to 93.60%.
That is a share of all the answers rather than of the ones that cited something, so it is a different denominator from every percentage above and does not belong in a sentence with them.
The gap is 4.8 points, which is modest and worth stating precisely instead of dressing up. The large majority of constrained questions still produced a cited answer.
A stack of constraints makes an engine marginally more likely to answer without reaching for a source at all. Fewer of those questions produced a citation, which means fewer of them produced an opportunity for anybody to be cited.
Operationally that means the constrained half of your query set will carry slightly more blanks, and a blank is not a loss. On those answers nobody was cited, including your competitors.
The questions that came back with nothing cited are the only part of this category where Car and Driver has no head start.
Keep a list of the constrained questions that came back with no cited source. Those are the questions nothing in your market answers well enough yet, and they are the cheapest content briefs you will write this quarter.
Why We Are Not Naming A Low-Authority Bucket
An obvious way to report this article would be a chart splitting citations into established and low-authority properties, with a headline about how small the second bucket turned out to be.
We are not doing that, and the reason matters more than the result.
We never wrote down a list of low-authority automotive domains before we looked. "Established" and "low-authority" here are read off the roster we observed, after the fact.
Defining that bucket now, having already seen that we found nothing in it, is exactly the after-the-fact line-drawing our own research rules ban. It would let us choose a boundary that produced a satisfying number.
So this is a weaker null than it would have been with a list written in advance. We can say the leading groups on both sides are made of well-known automotive publishers and data properties, and we can say no unfamiliar domain reached them.
We cannot put a percentage on a category we invented afterwards.
There is a second reason to refuse. A bucket drawn after the data has been seen is unfalsifiable in a specific way: the next analyst draws the boundary somewhere else and gets a different number, and neither of you can be shown wrong.
When a study tells you a class of sites is winning or losing, ask when that class was defined. Before the data or after it is the whole question, and it is rarely stated.
What This Means If You Are Not Car And Driver
Everything from here is judgment on what the pattern suggests. The numbers show what appeared alongside these answers. They do not show that changing any of it changes what gets cited.
The reachable layer in this data is the data layer. Getting a vehicle's specifications, pricing, and inventory correct and current inside the properties that publish that data is a different job from pitching an editorial reviewer, and it has a shorter feedback loop.
An editorial verdict is somebody's opinion, and you cannot supply it. A spec table is a fact, and you can.
Our own earlier automotive work found that manufacturer channels are largely absent from their own category, and nothing here contradicts it.
What it adds is that the properties standing between a brand and the answer are the ones everybody already knows. That is bad news for a challenger site and reasonably good news for a brand with real data to supply.
What we would not do on this evidence is start a content farm. The premise we went in with, that an unknown site can accumulate automotive citations at the rate an established one does, is the thing we went looking for and failed to find.
The travel comparison is worth keeping in view, because it is why we looked. The travel category does carry a content-farm layer that automotive appears to lack.
Two categories, two different answers, which is the argument for measuring your own rather than importing somebody else's finding.
There is an obvious objection to all of this, which is that we asked one set of questions in one month. That is fair, and it is the reason the recommendation is to run your own rather than to act on ours. What travels between categories is the method, not the roster.
Which properties carry you is a read off the citation list, ranked by weight rather than by reputation.
The account in that view is not an automotive brand, and the ranked-weight read is the part that transfers.
Pick the one data property that covers your segment and audit your own listings inside it this month. Specifications, trim-level pricing, and availability, checked against what you sell today.
Tag Your Queries By Specificity In Qvery Before You Track Them
Two lists again, though the split here is by specificity rather than by audience:
The plain list: your category and body-style terms, nothing else on the line.
The constrained list: the same terms with the real filters hung off them, meaning seats, drivetrain, budget, used or new, and the weather people drive in.
Set them up as two topics and let them run. Qvery asks them daily on ChatGPT and Google AI Mode, in over 200 countries, and captures every citation tied to the query and the engine that produced it.
Tag every tracked query by specificity when you create it, because retrofitting that tag onto a live query set is tedious and everyone puts it off.
Then read the two topic groups apart from each other:
Visibility per topic: whether you are named at all on each shape of question.
Top Domains per topic: editorial on one, data properties on the other, which tells you which team owns the fix.
The queries with no citation: your list of unanswered constrained questions.
The delta: whether the constrained topic moves after you correct your listings.
In Qvery Assistant you ask for the same cut in plain language, and the shipped templates include a citation audit, which is the shape of the roster work above.
Two things stay yours. Deciding whether a cited domain is editorial or data is a judgment call on a list of URLs, and Qvery captures the list rather than sorting it.
And it will not tell you a property is worth supplying data to. It will tell you whether that property is in your answers, which is the input to that decision.
If you take one thing from this article, make it the tagging. Everything else here follows from being able to read the two groups apart, and nothing else here works without that.
Start your free trial and tag your first month of automotive queries by how specific they are.
If the plain questions and the constrained ones return the same publishers in a different order, you are looking at what we found, and the work is in the order rather than in the list.

© 2026 Qvery AI OÜ