By
Vlad Shvets
What AI Engines Cite When Shoppers Ask for Product Recommendations
Which sites ChatGPT and Google AI Mode cite for ecommerce shopping and advice questions, how often brand-owned domains appear in each, and why one audit list is not enough.
Which sites ChatGPT and Google AI Mode cite for ecommerce shopping and advice questions, how often brand-owned domains appear in each, and why one audit list is not enough.
Which sites ChatGPT and Google AI Mode cite for ecommerce shopping and advice questions, how often brand-owned domains appear in each, and why one audit list is not enough.
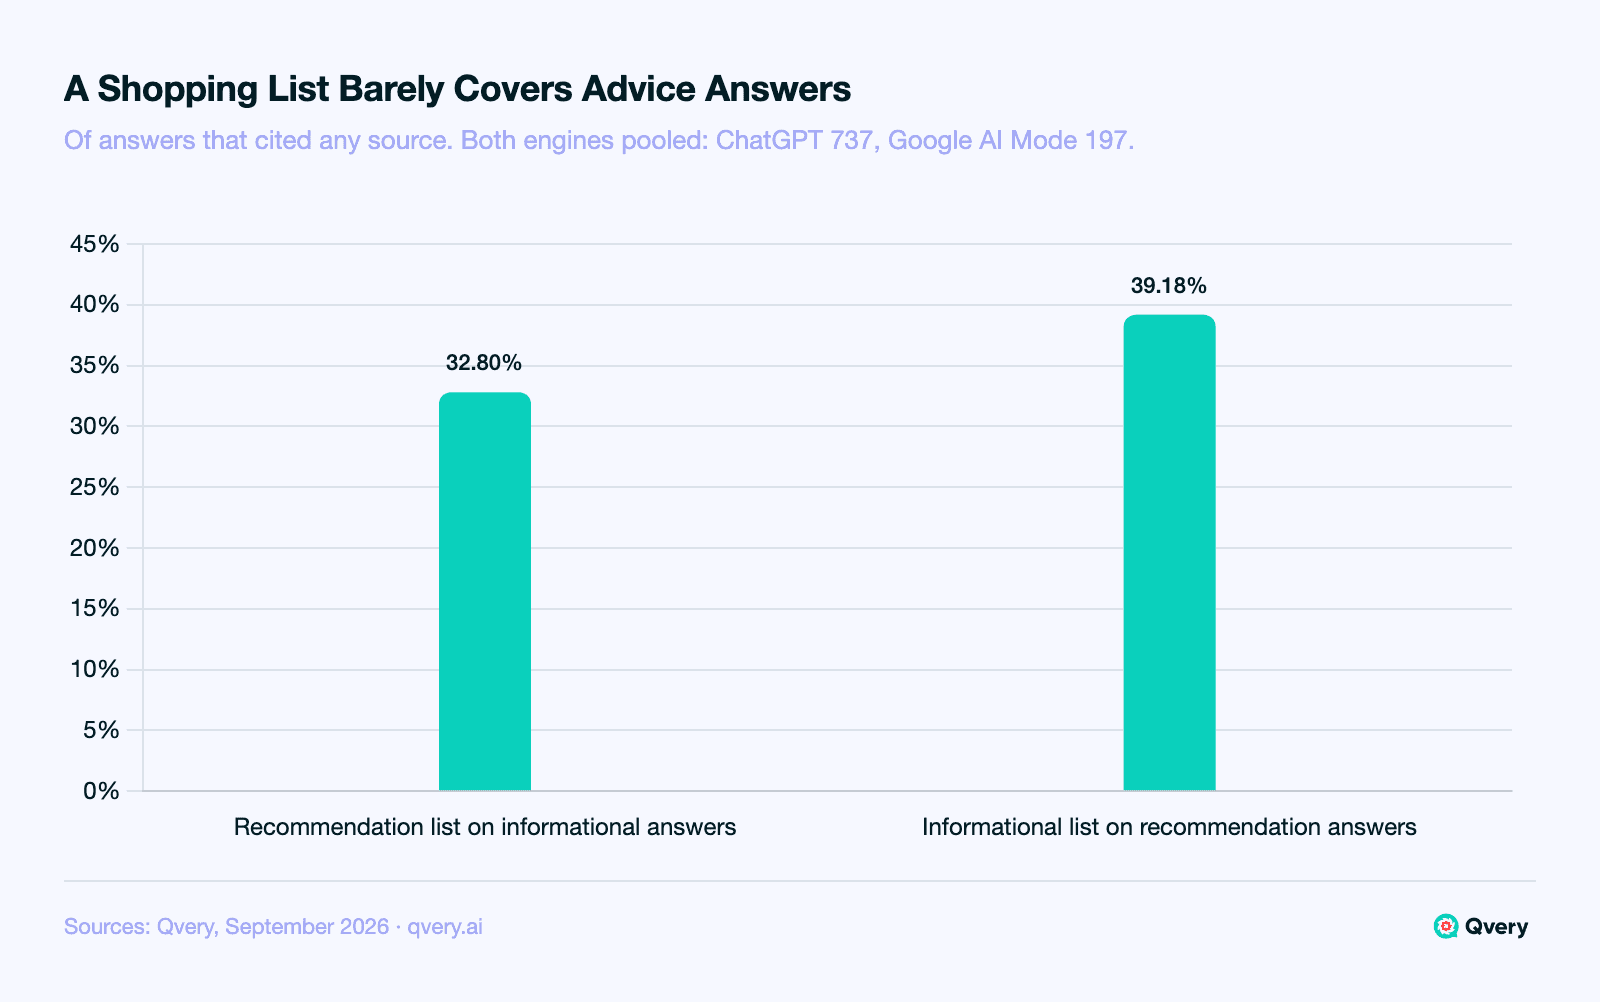
Ask ChatGPT for the best running shoes and ask it how to clean running shoes, and the two answers lean on different parts of the web. In September's ecommerce questions, the list of sites that covers 80% of recommendation answers reached only 32.80% of informational answers that cited any source (250 answers), and the reverse reached 39.18% (684 answers).
Brand-owned domains show up more in advice answers than in shopping answers: they appeared in 52.08% of informational answers (150 of 288) and 31.94% of recommendation answers (230 of 720), shares of all valid answers with ChatGPT and Google AI Mode pooled.
That leads to one decision.
Keep two source-audit lists, one for questions that ask what to buy and one for questions that ask how something works, because neither list covers much of the other.
What Was Measured
The June ecommerce query strings were run again, word for word, in September: three ChatGPT runs and one Google AI Mode run per question, pooled at that three-to-one mix. The recommendation questions span six categories, from electronics and home and kitchen to apparel, beauty, fitness gear and baby products.
That gives 720 valid recommendation answers (540 ChatGPT, 180 Google AI Mode) and 288 valid informational answers (216 ChatGPT, 72 Google AI Mode). Of those, 684 recommendation and 250 informational answers cited at least one source.
Two denominators appear below, named once here. Brand-owned rates are shares of all valid answers in the slice. Audit lists and cross-coverage are of answers that cited any source.
June's sources were stored differently, so no June figure appears and nothing here is a trend.
Which Sites Each Kind of Shopping Question Leans On
Recommendation answers are concentrated: four domains cover half of the recommendation answers that cited any source.
Informational answers need eight for the same half.
Recommendation 80% list (covers 80% of the 684 recommendation answers that cited any source): google.com, tomsguide.com, aad.org, allrecipes.com, consumerreports.org, yougov.com, nhs.uk, fleetfeet.com, verywellfit.com, which.co.uk, reddit.com, rei.com. The first four are the 50% head.
Informational 80% list (covers 80% of the 250 informational answers that cited any source): consumerreports.org, energystar.gov, nih.gov, youtube.com, epa.gov, which.co.uk, rei.com, rtings.com, sleepfoundation.org, reddit.com, angi.com, astm.org, cpsc.gov, fda.gov, mercerandgray.com, nationalhardwaregroup.com, samsung.com, bash.com, foodandwine.com, microsoft.com, monos.com, osha.gov, seriouseats.com, techradar.com, weatherguardcanada.com, whirlpool.com, wiley.com. The first eight are the 50% head.
Cross-coverage: the recommendation list covers 32.80% of informational answers that cited any source, and the informational list covers 39.18% of recommendation answers that cited any source. The smaller, 0.3280, sits well under the 0.60 bar, so each question type gets its own list.
Four domains sit on both lists: consumerreports.org, which.co.uk, reddit.com and rei.com.
Everything else is specific to one kind of question, which is the practical reason one audit cannot serve both.
Our guide on how to run a content gap analysis covers the method for turning a list like this into work.
A shopper asking what to buy and a shopper asking how it works are, as far as the cited web goes, visiting two different libraries.
How Often Brand-Owned Sites Appear, by Question Type
Brand-owned domains appeared in 31.94% of recommendation answers (230 of 720) and 52.08% of informational answers (150 of 288). The recommendation-to-informational ratio is 0.61, which supports the informational direction.
No answer in either slice was left unresolved.
The brand-owned rate counts any brand's domain, not only yours: a manufacturer's care guide in an advice answer counts the same as a retailer's product page.
Yotpo frames the goal this way: "When a shopper asks for a recommendation, the engine doesn't just retrieve a list of websites. It writes an answer by pulling together a mix of sources, and your job is to be one of them." The data agrees that answers pull from a mix.
It adds that the mix differs by question type, so "one of them" means a different list for each.
These numbers do not settle how marketplaces, review publishers or communities compare across the two question types. Those named-set counts were not part of this collection.
ChatGPT and Google AI Mode on Shopping Answers
Inside recommendation answers, the two engines cite brand-owned domains at similar rates: ChatGPT 33.15% (179 of 540) and Google AI Mode 28.33% (51 of 180), shares of all valid recommendation answers for each engine.
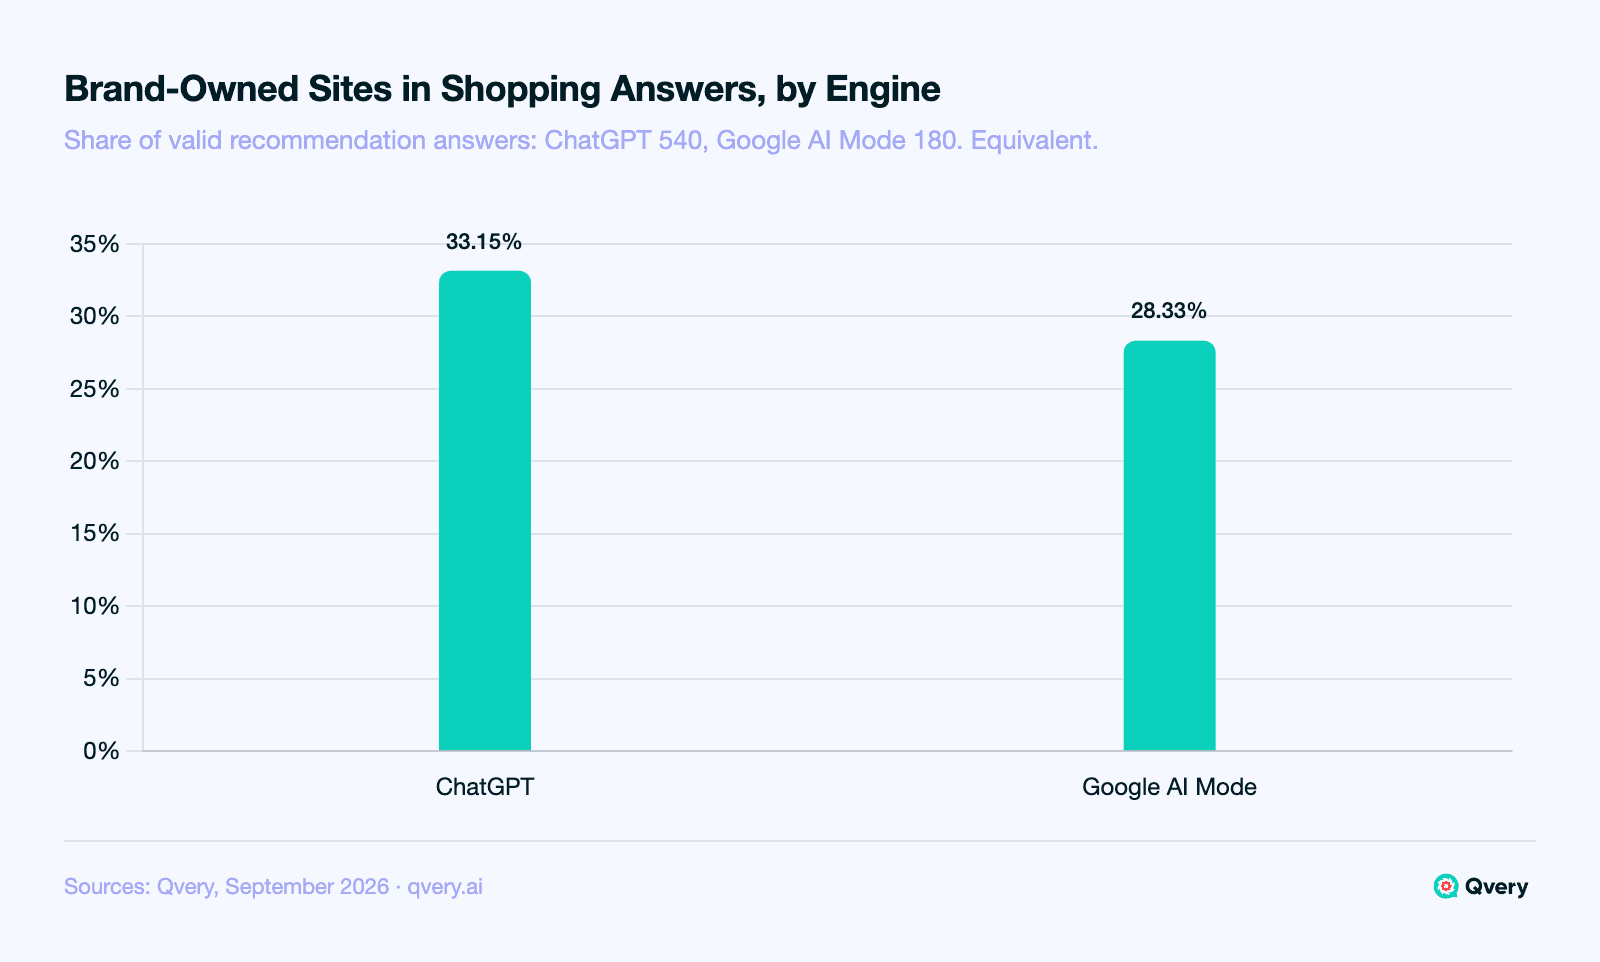
The ChatGPT-to-Google ratio is 1.17, inside the equivalent band.
Before the runs we predicted an equivalent result, and that is what came back.
Google AI Mode's informational answers are not reported by engine here; only 37 of them cited a source, too few to publish a rate.
Is This Channel Worth an Audit?
The case for auditing shopping answers at all rests on who asks and what happens next.
Who asks: Pew Research Center found that 34% of U.S. adults had ever used ChatGPT in its 2025 survey, and Google said in June 2026 that AI Mode had surpassed one billion monthly users. One is a share of adults and the other a monthly count, so they are never added.
What Google draws on: Google describes AI Mode's shopping answers as built on its Shopping Graph, over 45 billion product listings, with more than 2 billion listings updated every hour.
What the visit is worth: Similarweb estimates that visits referred by ChatGPT convert at 11.4%, against 5.3% for organic search. That is Similarweb's estimate, not a promise for your store.
Track Shopping and Advice Questions Separately in Qvery
The lists above come from one set of questions. Yours will differ, and in Qvery you add and edit your own topics and queries, so shopping questions and advice questions can sit in two separate topics with their own lists.
Qvery tracks visibility, share of voice and average rank across ChatGPT and Google AI Mode daily, in 200+ countries, and ties every citation to the query and engine that produced it. Qvery Assistant sits in the app and answers plain-language questions about your own data, such as which domains your tracked answers cite most this month.
For the tools that do this work, our comparison of AI visibility tools for ecommerce goes vendor by vendor.
Start your free trial: 7 days on the paid plans, self-serve checkout, and no credit card required.
What These Numbers Do Not Say
Brand-owned rates are shares of all valid answers: 720 recommendation and 288 informational answers pooled, and 540 ChatGPT and 180 Google AI Mode recommendation answers for the engine figures. Lists and cross-coverage are shares of answers that cited any source, 684 and 250.
Nothing here compares June with September or explains why a source appeared. A cited domain is not a recommended brand, and no source's quality, weight or share of budget is judged. The Pew, Google and Similarweb figures describe their own populations, not this corpus.
What to Do With This
Build two audit lists, one for questions that ask what to buy and one for questions that ask how things work: the recommendation list covers only 32.80% of informational answers that cited any source, and the informational list 39.18% of recommendation answers.
Then check your own domain in both, knowing brand-owned sites appear in 52.08% of informational answers and 31.94% of recommendation answers.
Ask ChatGPT for the best running shoes and ask it how to clean running shoes, and the two answers lean on different parts of the web. In September's ecommerce questions, the list of sites that covers 80% of recommendation answers reached only 32.80% of informational answers that cited any source (250 answers), and the reverse reached 39.18% (684 answers).
Brand-owned domains show up more in advice answers than in shopping answers: they appeared in 52.08% of informational answers (150 of 288) and 31.94% of recommendation answers (230 of 720), shares of all valid answers with ChatGPT and Google AI Mode pooled.
That leads to one decision.
Keep two source-audit lists, one for questions that ask what to buy and one for questions that ask how something works, because neither list covers much of the other.
What Was Measured
The June ecommerce query strings were run again, word for word, in September: three ChatGPT runs and one Google AI Mode run per question, pooled at that three-to-one mix. The recommendation questions span six categories, from electronics and home and kitchen to apparel, beauty, fitness gear and baby products.
That gives 720 valid recommendation answers (540 ChatGPT, 180 Google AI Mode) and 288 valid informational answers (216 ChatGPT, 72 Google AI Mode). Of those, 684 recommendation and 250 informational answers cited at least one source.
Two denominators appear below, named once here. Brand-owned rates are shares of all valid answers in the slice. Audit lists and cross-coverage are of answers that cited any source.
June's sources were stored differently, so no June figure appears and nothing here is a trend.
Which Sites Each Kind of Shopping Question Leans On
Recommendation answers are concentrated: four domains cover half of the recommendation answers that cited any source.
Informational answers need eight for the same half.
Recommendation 80% list (covers 80% of the 684 recommendation answers that cited any source): google.com, tomsguide.com, aad.org, allrecipes.com, consumerreports.org, yougov.com, nhs.uk, fleetfeet.com, verywellfit.com, which.co.uk, reddit.com, rei.com. The first four are the 50% head.
Informational 80% list (covers 80% of the 250 informational answers that cited any source): consumerreports.org, energystar.gov, nih.gov, youtube.com, epa.gov, which.co.uk, rei.com, rtings.com, sleepfoundation.org, reddit.com, angi.com, astm.org, cpsc.gov, fda.gov, mercerandgray.com, nationalhardwaregroup.com, samsung.com, bash.com, foodandwine.com, microsoft.com, monos.com, osha.gov, seriouseats.com, techradar.com, weatherguardcanada.com, whirlpool.com, wiley.com. The first eight are the 50% head.
Cross-coverage: the recommendation list covers 32.80% of informational answers that cited any source, and the informational list covers 39.18% of recommendation answers that cited any source. The smaller, 0.3280, sits well under the 0.60 bar, so each question type gets its own list.
Four domains sit on both lists: consumerreports.org, which.co.uk, reddit.com and rei.com.
Everything else is specific to one kind of question, which is the practical reason one audit cannot serve both.
Our guide on how to run a content gap analysis covers the method for turning a list like this into work.
A shopper asking what to buy and a shopper asking how it works are, as far as the cited web goes, visiting two different libraries.
How Often Brand-Owned Sites Appear, by Question Type
Brand-owned domains appeared in 31.94% of recommendation answers (230 of 720) and 52.08% of informational answers (150 of 288). The recommendation-to-informational ratio is 0.61, which supports the informational direction.
No answer in either slice was left unresolved.
The brand-owned rate counts any brand's domain, not only yours: a manufacturer's care guide in an advice answer counts the same as a retailer's product page.
Yotpo frames the goal this way: "When a shopper asks for a recommendation, the engine doesn't just retrieve a list of websites. It writes an answer by pulling together a mix of sources, and your job is to be one of them." The data agrees that answers pull from a mix.
It adds that the mix differs by question type, so "one of them" means a different list for each.
These numbers do not settle how marketplaces, review publishers or communities compare across the two question types. Those named-set counts were not part of this collection.
ChatGPT and Google AI Mode on Shopping Answers
Inside recommendation answers, the two engines cite brand-owned domains at similar rates: ChatGPT 33.15% (179 of 540) and Google AI Mode 28.33% (51 of 180), shares of all valid recommendation answers for each engine.
The ChatGPT-to-Google ratio is 1.17, inside the equivalent band.
Before the runs we predicted an equivalent result, and that is what came back.
Google AI Mode's informational answers are not reported by engine here; only 37 of them cited a source, too few to publish a rate.
Is This Channel Worth an Audit?
The case for auditing shopping answers at all rests on who asks and what happens next.
Who asks: Pew Research Center found that 34% of U.S. adults had ever used ChatGPT in its 2025 survey, and Google said in June 2026 that AI Mode had surpassed one billion monthly users. One is a share of adults and the other a monthly count, so they are never added.
What Google draws on: Google describes AI Mode's shopping answers as built on its Shopping Graph, over 45 billion product listings, with more than 2 billion listings updated every hour.
What the visit is worth: Similarweb estimates that visits referred by ChatGPT convert at 11.4%, against 5.3% for organic search. That is Similarweb's estimate, not a promise for your store.
Track Shopping and Advice Questions Separately in Qvery
The lists above come from one set of questions. Yours will differ, and in Qvery you add and edit your own topics and queries, so shopping questions and advice questions can sit in two separate topics with their own lists.
Qvery tracks visibility, share of voice and average rank across ChatGPT and Google AI Mode daily, in 200+ countries, and ties every citation to the query and engine that produced it. Qvery Assistant sits in the app and answers plain-language questions about your own data, such as which domains your tracked answers cite most this month.
For the tools that do this work, our comparison of AI visibility tools for ecommerce goes vendor by vendor.
Start your free trial: 7 days on the paid plans, self-serve checkout, and no credit card required.
What These Numbers Do Not Say
Brand-owned rates are shares of all valid answers: 720 recommendation and 288 informational answers pooled, and 540 ChatGPT and 180 Google AI Mode recommendation answers for the engine figures. Lists and cross-coverage are shares of answers that cited any source, 684 and 250.
Nothing here compares June with September or explains why a source appeared. A cited domain is not a recommended brand, and no source's quality, weight or share of budget is judged. The Pew, Google and Similarweb figures describe their own populations, not this corpus.
What to Do With This
Build two audit lists, one for questions that ask what to buy and one for questions that ask how things work: the recommendation list covers only 32.80% of informational answers that cited any source, and the informational list 39.18% of recommendation answers.
Then check your own domain in both, knowing brand-owned sites appear in 52.08% of informational answers and 31.94% of recommendation answers.
Ask ChatGPT for the best running shoes and ask it how to clean running shoes, and the two answers lean on different parts of the web. In September's ecommerce questions, the list of sites that covers 80% of recommendation answers reached only 32.80% of informational answers that cited any source (250 answers), and the reverse reached 39.18% (684 answers).
Brand-owned domains show up more in advice answers than in shopping answers: they appeared in 52.08% of informational answers (150 of 288) and 31.94% of recommendation answers (230 of 720), shares of all valid answers with ChatGPT and Google AI Mode pooled.
That leads to one decision.
Keep two source-audit lists, one for questions that ask what to buy and one for questions that ask how something works, because neither list covers much of the other.
What Was Measured
The June ecommerce query strings were run again, word for word, in September: three ChatGPT runs and one Google AI Mode run per question, pooled at that three-to-one mix. The recommendation questions span six categories, from electronics and home and kitchen to apparel, beauty, fitness gear and baby products.
That gives 720 valid recommendation answers (540 ChatGPT, 180 Google AI Mode) and 288 valid informational answers (216 ChatGPT, 72 Google AI Mode). Of those, 684 recommendation and 250 informational answers cited at least one source.
Two denominators appear below, named once here. Brand-owned rates are shares of all valid answers in the slice. Audit lists and cross-coverage are of answers that cited any source.
June's sources were stored differently, so no June figure appears and nothing here is a trend.
Which Sites Each Kind of Shopping Question Leans On
Recommendation answers are concentrated: four domains cover half of the recommendation answers that cited any source.
Informational answers need eight for the same half.
Recommendation 80% list (covers 80% of the 684 recommendation answers that cited any source): google.com, tomsguide.com, aad.org, allrecipes.com, consumerreports.org, yougov.com, nhs.uk, fleetfeet.com, verywellfit.com, which.co.uk, reddit.com, rei.com. The first four are the 50% head.
Informational 80% list (covers 80% of the 250 informational answers that cited any source): consumerreports.org, energystar.gov, nih.gov, youtube.com, epa.gov, which.co.uk, rei.com, rtings.com, sleepfoundation.org, reddit.com, angi.com, astm.org, cpsc.gov, fda.gov, mercerandgray.com, nationalhardwaregroup.com, samsung.com, bash.com, foodandwine.com, microsoft.com, monos.com, osha.gov, seriouseats.com, techradar.com, weatherguardcanada.com, whirlpool.com, wiley.com. The first eight are the 50% head.
Cross-coverage: the recommendation list covers 32.80% of informational answers that cited any source, and the informational list covers 39.18% of recommendation answers that cited any source. The smaller, 0.3280, sits well under the 0.60 bar, so each question type gets its own list.
Four domains sit on both lists: consumerreports.org, which.co.uk, reddit.com and rei.com.
Everything else is specific to one kind of question, which is the practical reason one audit cannot serve both.
Our guide on how to run a content gap analysis covers the method for turning a list like this into work.
A shopper asking what to buy and a shopper asking how it works are, as far as the cited web goes, visiting two different libraries.
How Often Brand-Owned Sites Appear, by Question Type
Brand-owned domains appeared in 31.94% of recommendation answers (230 of 720) and 52.08% of informational answers (150 of 288). The recommendation-to-informational ratio is 0.61, which supports the informational direction.
No answer in either slice was left unresolved.
The brand-owned rate counts any brand's domain, not only yours: a manufacturer's care guide in an advice answer counts the same as a retailer's product page.
Yotpo frames the goal this way: "When a shopper asks for a recommendation, the engine doesn't just retrieve a list of websites. It writes an answer by pulling together a mix of sources, and your job is to be one of them." The data agrees that answers pull from a mix.
It adds that the mix differs by question type, so "one of them" means a different list for each.
These numbers do not settle how marketplaces, review publishers or communities compare across the two question types. Those named-set counts were not part of this collection.
ChatGPT and Google AI Mode on Shopping Answers
Inside recommendation answers, the two engines cite brand-owned domains at similar rates: ChatGPT 33.15% (179 of 540) and Google AI Mode 28.33% (51 of 180), shares of all valid recommendation answers for each engine.
The ChatGPT-to-Google ratio is 1.17, inside the equivalent band.
Before the runs we predicted an equivalent result, and that is what came back.
Google AI Mode's informational answers are not reported by engine here; only 37 of them cited a source, too few to publish a rate.
Is This Channel Worth an Audit?
The case for auditing shopping answers at all rests on who asks and what happens next.
Who asks: Pew Research Center found that 34% of U.S. adults had ever used ChatGPT in its 2025 survey, and Google said in June 2026 that AI Mode had surpassed one billion monthly users. One is a share of adults and the other a monthly count, so they are never added.
What Google draws on: Google describes AI Mode's shopping answers as built on its Shopping Graph, over 45 billion product listings, with more than 2 billion listings updated every hour.
What the visit is worth: Similarweb estimates that visits referred by ChatGPT convert at 11.4%, against 5.3% for organic search. That is Similarweb's estimate, not a promise for your store.
Track Shopping and Advice Questions Separately in Qvery
The lists above come from one set of questions. Yours will differ, and in Qvery you add and edit your own topics and queries, so shopping questions and advice questions can sit in two separate topics with their own lists.
Qvery tracks visibility, share of voice and average rank across ChatGPT and Google AI Mode daily, in 200+ countries, and ties every citation to the query and engine that produced it. Qvery Assistant sits in the app and answers plain-language questions about your own data, such as which domains your tracked answers cite most this month.
For the tools that do this work, our comparison of AI visibility tools for ecommerce goes vendor by vendor.
Start your free trial: 7 days on the paid plans, self-serve checkout, and no credit card required.
What These Numbers Do Not Say
Brand-owned rates are shares of all valid answers: 720 recommendation and 288 informational answers pooled, and 540 ChatGPT and 180 Google AI Mode recommendation answers for the engine figures. Lists and cross-coverage are shares of answers that cited any source, 684 and 250.
Nothing here compares June with September or explains why a source appeared. A cited domain is not a recommended brand, and no source's quality, weight or share of budget is judged. The Pew, Google and Similarweb figures describe their own populations, not this corpus.
What to Do With This
Build two audit lists, one for questions that ask what to buy and one for questions that ask how things work: the recommendation list covers only 32.80% of informational answers that cited any source, and the informational list 39.18% of recommendation answers.
Then check your own domain in both, knowing brand-owned sites appear in 52.08% of informational answers and 31.94% of recommendation answers.
Ask ChatGPT for the best running shoes and ask it how to clean running shoes, and the two answers lean on different parts of the web. In September's ecommerce questions, the list of sites that covers 80% of recommendation answers reached only 32.80% of informational answers that cited any source (250 answers), and the reverse reached 39.18% (684 answers).
Brand-owned domains show up more in advice answers than in shopping answers: they appeared in 52.08% of informational answers (150 of 288) and 31.94% of recommendation answers (230 of 720), shares of all valid answers with ChatGPT and Google AI Mode pooled.
That leads to one decision.
Keep two source-audit lists, one for questions that ask what to buy and one for questions that ask how something works, because neither list covers much of the other.
What Was Measured
The June ecommerce query strings were run again, word for word, in September: three ChatGPT runs and one Google AI Mode run per question, pooled at that three-to-one mix. The recommendation questions span six categories, from electronics and home and kitchen to apparel, beauty, fitness gear and baby products.
That gives 720 valid recommendation answers (540 ChatGPT, 180 Google AI Mode) and 288 valid informational answers (216 ChatGPT, 72 Google AI Mode). Of those, 684 recommendation and 250 informational answers cited at least one source.
Two denominators appear below, named once here. Brand-owned rates are shares of all valid answers in the slice. Audit lists and cross-coverage are of answers that cited any source.
June's sources were stored differently, so no June figure appears and nothing here is a trend.
Which Sites Each Kind of Shopping Question Leans On
Recommendation answers are concentrated: four domains cover half of the recommendation answers that cited any source.
Informational answers need eight for the same half.
Recommendation 80% list (covers 80% of the 684 recommendation answers that cited any source): google.com, tomsguide.com, aad.org, allrecipes.com, consumerreports.org, yougov.com, nhs.uk, fleetfeet.com, verywellfit.com, which.co.uk, reddit.com, rei.com. The first four are the 50% head.
Informational 80% list (covers 80% of the 250 informational answers that cited any source): consumerreports.org, energystar.gov, nih.gov, youtube.com, epa.gov, which.co.uk, rei.com, rtings.com, sleepfoundation.org, reddit.com, angi.com, astm.org, cpsc.gov, fda.gov, mercerandgray.com, nationalhardwaregroup.com, samsung.com, bash.com, foodandwine.com, microsoft.com, monos.com, osha.gov, seriouseats.com, techradar.com, weatherguardcanada.com, whirlpool.com, wiley.com. The first eight are the 50% head.
Cross-coverage: the recommendation list covers 32.80% of informational answers that cited any source, and the informational list covers 39.18% of recommendation answers that cited any source. The smaller, 0.3280, sits well under the 0.60 bar, so each question type gets its own list.
Four domains sit on both lists: consumerreports.org, which.co.uk, reddit.com and rei.com.
Everything else is specific to one kind of question, which is the practical reason one audit cannot serve both.
Our guide on how to run a content gap analysis covers the method for turning a list like this into work.
A shopper asking what to buy and a shopper asking how it works are, as far as the cited web goes, visiting two different libraries.
How Often Brand-Owned Sites Appear, by Question Type
Brand-owned domains appeared in 31.94% of recommendation answers (230 of 720) and 52.08% of informational answers (150 of 288). The recommendation-to-informational ratio is 0.61, which supports the informational direction.
No answer in either slice was left unresolved.
The brand-owned rate counts any brand's domain, not only yours: a manufacturer's care guide in an advice answer counts the same as a retailer's product page.
Yotpo frames the goal this way: "When a shopper asks for a recommendation, the engine doesn't just retrieve a list of websites. It writes an answer by pulling together a mix of sources, and your job is to be one of them." The data agrees that answers pull from a mix.
It adds that the mix differs by question type, so "one of them" means a different list for each.
These numbers do not settle how marketplaces, review publishers or communities compare across the two question types. Those named-set counts were not part of this collection.
ChatGPT and Google AI Mode on Shopping Answers
Inside recommendation answers, the two engines cite brand-owned domains at similar rates: ChatGPT 33.15% (179 of 540) and Google AI Mode 28.33% (51 of 180), shares of all valid recommendation answers for each engine.
The ChatGPT-to-Google ratio is 1.17, inside the equivalent band.
Before the runs we predicted an equivalent result, and that is what came back.
Google AI Mode's informational answers are not reported by engine here; only 37 of them cited a source, too few to publish a rate.
Is This Channel Worth an Audit?
The case for auditing shopping answers at all rests on who asks and what happens next.
Who asks: Pew Research Center found that 34% of U.S. adults had ever used ChatGPT in its 2025 survey, and Google said in June 2026 that AI Mode had surpassed one billion monthly users. One is a share of adults and the other a monthly count, so they are never added.
What Google draws on: Google describes AI Mode's shopping answers as built on its Shopping Graph, over 45 billion product listings, with more than 2 billion listings updated every hour.
What the visit is worth: Similarweb estimates that visits referred by ChatGPT convert at 11.4%, against 5.3% for organic search. That is Similarweb's estimate, not a promise for your store.
Track Shopping and Advice Questions Separately in Qvery
The lists above come from one set of questions. Yours will differ, and in Qvery you add and edit your own topics and queries, so shopping questions and advice questions can sit in two separate topics with their own lists.
Qvery tracks visibility, share of voice and average rank across ChatGPT and Google AI Mode daily, in 200+ countries, and ties every citation to the query and engine that produced it. Qvery Assistant sits in the app and answers plain-language questions about your own data, such as which domains your tracked answers cite most this month.
For the tools that do this work, our comparison of AI visibility tools for ecommerce goes vendor by vendor.
Start your free trial: 7 days on the paid plans, self-serve checkout, and no credit card required.
What These Numbers Do Not Say
Brand-owned rates are shares of all valid answers: 720 recommendation and 288 informational answers pooled, and 540 ChatGPT and 180 Google AI Mode recommendation answers for the engine figures. Lists and cross-coverage are shares of answers that cited any source, 684 and 250.
Nothing here compares June with September or explains why a source appeared. A cited domain is not a recommended brand, and no source's quality, weight or share of budget is judged. The Pew, Google and Similarweb figures describe their own populations, not this corpus.
What to Do With This
Build two audit lists, one for questions that ask what to buy and one for questions that ask how things work: the recommendation list covers only 32.80% of informational answers that cited any source, and the informational list 39.18% of recommendation answers.
Then check your own domain in both, knowing brand-owned sites appear in 52.08% of informational answers and 31.94% of recommendation answers.

© 2026 Qvery AI OÜ