By
Vlad Shvets
Travel AI Search Statistics 2026: What ChatGPT and Google AI Mode Cite When Travelers Ask
Recommendation and information travel questions draw on different sites in ChatGPT and Google AI Mode. The rates, the domain lists, and the market context.
Recommendation and information travel questions draw on different sites in ChatGPT and Google AI Mode. The rates, the domain lists, and the market context.
Recommendation and information travel questions draw on different sites in ChatGPT and Google AI Mode. The rates, the domain lists, and the market context.
Most travel marketers who check their AI visibility do it with one list of prompts: a few questions about the best hotels in Lisbon, a few about visas for Japan, one average at the end. That average is the problem. We asked ChatGPT and Google AI Mode the recommendation questions and the information questions travelers type, in September 2026, and scored each answer by the kinds of sites it cited.
The answers draw on different sites depending on which kind of question was asked. Platform and community sites showed up in 38.25% of recommendation answers and 9.23% of information answers. Brand-owned sites moved the same way, 73.02% against 41.70%. These are co-occurrence rates, not causes, and nothing here measures whether a particular brand was named.
Key Takeaways
Platform and community domains appeared in 38.25% of recommendation answers and 9.23% of information answers, a ratio of 4.15, across ChatGPT and Google AI Mode.
Brand-owned domains appeared in 73.02% of recommendation answers and 41.70% of information answers, a ratio of 1.75.
The domains that head each kind of answer barely overlap, so each kind of question needs its own list of sites to watch.
Context: 41% of travelers say they are interested in using AI to curate trips, and 61% find trip ideas on social media platforms, up from 35% in 2022.
Context: Google says AI Mode has surpassed one billion monthly users; OpenAI says ChatGPT has more than 900 million weekly active users.
Do Travelers Want AI's Help Planning Trips?
The market numbers describe interest and intent more than settled habit, and it is worth reading them that way.
41% of travelers are interested in using AI to curate trips, according to Booking.com's travel predictions. That is interest, not current use.
Two-thirds (66%) will use technology to make informed decisions and find authentic experiences, from the same Booking.com release. Technology, in that sentence, is broader than AI.
AI Mode queries related to planning grew faster than AI Mode queries overall by 80% over six months, per Google. That covers planning of every kind, not travel alone.
None of these says travelers already plan trips with AI by default. They say the demand is there and rising, which is the reason to check what the engines cite before the habit settles.
How Large Are the Two Engines Measured Here?
Google AI Mode has surpassed one billion monthly users, Google said in June 2026.
ChatGPT has more than 900 million weekly active users, OpenAI said in March 2026.
One figure counts monthly users and the other weekly, so they don't add up or rank against each other. Both are large enough that a travel brand's absence from either engine is a real gap, not a rounding error.
Do Travelers Already Take Trip Ideas From Platforms?
61% of travelers now find trip ideas on social media platforms, up from 35% in 2022, according to Expedia Group's 2025 Traveler Value Index. That is a figure about where people look for inspiration, not about what AI engines cite, and it differs from the platform-and-community share below. It is the reason a platform presence check belongs in a travel team's routine at all.
Platform and Community Sites Show Up Far More on Recommendation Questions
When a traveler asks for a recommendation (where to stay, which tour to book, what to do in a city), platform and community domains appeared in 38.25% of answers. When the traveler asks for information (entry rules, travel insurance, what a points program covers), they appeared in 9.23%. The recommendation rate is 4.15 times the information rate.
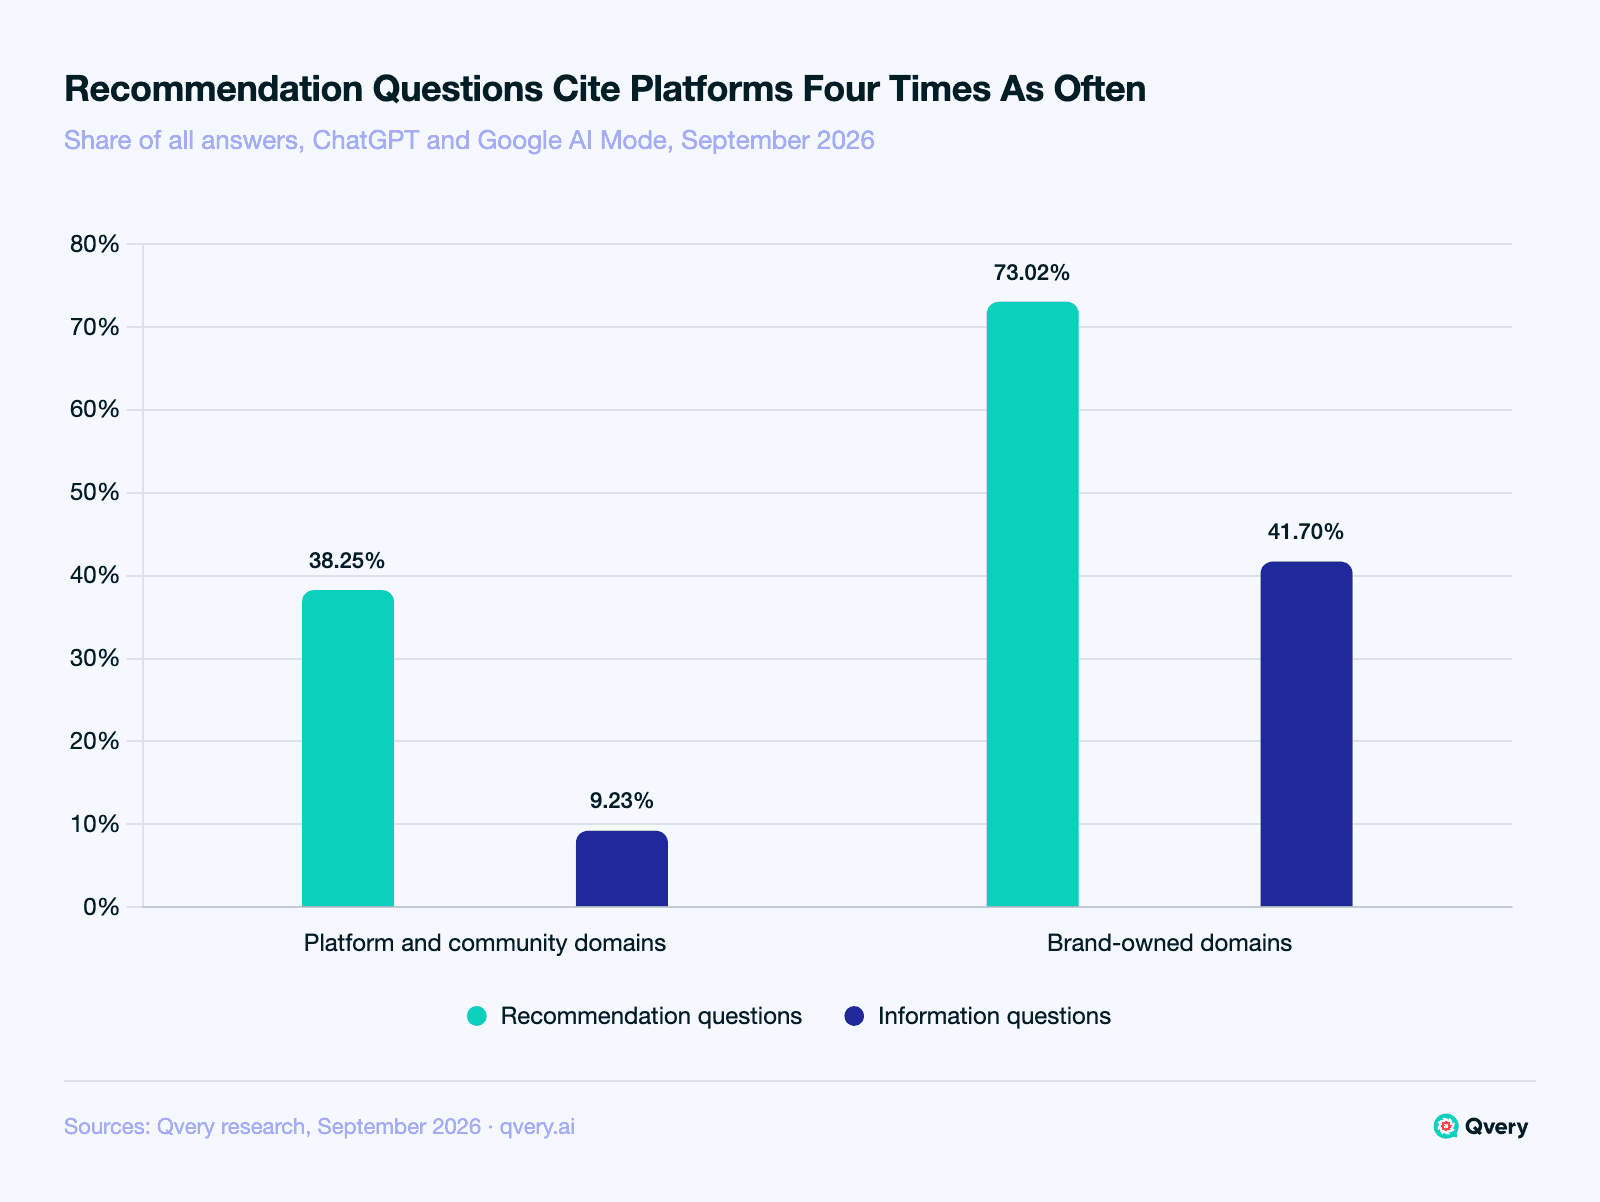
Both rates are shares of every answer in their slice, across ChatGPT and Google AI Mode together. The practical consequence is about where a community check belongs. If your prompt list mixes the two kinds of question, the blended rate lands somewhere between 38.25% and 9.23% and describes neither: it understates platforms on the questions where travelers choose, and overstates them on the questions where they only need facts.
Percepture's tourism playbook tells travel brands to "See whether your destination, hotel, attraction, or tour brand appears for real traveler prompts." The data supports half of that advice: the kind of prompt changes which layers of the web show up, which is a good reason to test real traveler prompts of each kind. It doesn't show whether any particular brand appears, because this study didn't measure naming.
Brand-Owned Sites Move With the Question Too
Brand-owned domains appeared in 73.02% of recommendation answers and 41.70% of information answers, a ratio of 1.75. Owned sites appear in most recommendation answers and in a large minority of information answers, and that gap is wide enough that a single owned-presence baseline hides it.
A brand that sees itself cited in about half of AI answers from a mixed prompt list is looking at an average of two different situations. On recommendation questions, owned sites are in nearly three answers out of four; on information questions, in two out of five.
The Tourism Marketing Agency argues that tour operators can improve direct booking visibility "by creating structured destination content, strengthening internal linking and publishing answer focused travel pages aligned with user intent". That may well be sound advice, and nothing here tests it: this study measured which kinds of sites appear alongside answers, not which content formats earn a citation or a booking.
Which Domains Head Each Kind of Answer
This is the supporting table for anyone building a watch list. The shares below are of answers that cited any source, within each slice.
Recommendation questions, the domains covering half of cited answers: kayak.com, getyourguide.com, booking.com, reddit.com.
Recommendation questions, the list covering 80%: kayak.com, getyourguide.com, booking.com, reddit.com, costcotravel.com, squaremouth.com, google.com, jet2holidays.com, priceline.com, cruisedirect.com, allianztravelinsurance.com, wanderlog.com.
Information questions, the domains covering half of cited answers: state.gov, chase.com, thepointsguy.com, transportation.gov, gc.ca, going.com.
Information questions, the list covering 80%: state.gov, chase.com, thepointsguy.com, transportation.gov, gc.ca, going.com, google.com, nerdwallet.com, aa.com, blog.google, gov.uk, sciencedirect.com, aaa.com, canada.ca, lonelyplanet.com, budgetyourtrip.com, cdc.gov, consumerfinance.gov, gosortie.app, iata.org, origins.com.
Cross-coverage: the recommendation list covers 11.02% of information answers that cited any source; the information list covers 28.21% of recommendation answers that cited any source.
Verdict: each kind of question needs its own list.
The Tourism Marketing Agency also describes AI systems that "compare information across multiple digital sources to determine which businesses appear most contextually reliable for a traveller's intent." The lists above are consistent with intent mattering, since the memberships barely overlap, but they show which domains appear, not how an engine chooses them.
For how to build and maintain a list like this, our travel AI visibility measurement playbook walks through the method. Its own separate-lists call was made on pre-trip versus in-destination questions, a different split from the recommendation and information questions measured here.
Run the Two-Slice Check on Your Own Prompts
The finding above only helps if you can see your own two slices. In Qvery, you add and edit the queries you track, so you can keep your recommendation questions and your information questions as two separate sets. Qvery then tracks your visibility, share of voice, and average rank across ChatGPT and Google AI Mode every day, and captures every citation tied to the query and engine that produced it.
From there, ask Qvery Assistant in plain language which of your recommendation queries you appear in, and which domains the engines cited on the ones where you don't. What Qvery won't do is sort citations into this study's platform-and-community and brand-owned labels, or build the coverage lists for you; you read the cited domains and decide.
To see your own two slices, start a free 7-day trial. No credit card is required.
The Limits of These Numbers
These rates describe which kinds of sites appear alongside answers, not what causes an engine to cite them. The other boundaries are worth knowing before you quote them:
No engine ranking. Engine differences are context only in travel; our look at how travel brands show up in AI search covers that ground.
A lean toward ChatGPT. The pooled rates lean toward ChatGPT, which answered each question more often than Google AI Mode did.
No naming measured. Nothing here measures whether a brand was named or recommended.
One question set. The results cover the travel recommendation and information questions we asked in September 2026, not every travel sector, persona, or question set.
No trend line. Earlier collections used a different method, so no comparison over time is drawn.
One unclassified answer. One recommendation answer could not be classified, and counting it either way changes no finding.
Measure Travel Visibility as Two Slices
Track travel recommendation questions and travel information questions as two separate slices, each with its own platform-and-community and brand-owned baseline, and build each slice's domain list with the method in the measurement playbook. One blended number describes neither kind of traveler.
Most travel marketers who check their AI visibility do it with one list of prompts: a few questions about the best hotels in Lisbon, a few about visas for Japan, one average at the end. That average is the problem. We asked ChatGPT and Google AI Mode the recommendation questions and the information questions travelers type, in September 2026, and scored each answer by the kinds of sites it cited.
The answers draw on different sites depending on which kind of question was asked. Platform and community sites showed up in 38.25% of recommendation answers and 9.23% of information answers. Brand-owned sites moved the same way, 73.02% against 41.70%. These are co-occurrence rates, not causes, and nothing here measures whether a particular brand was named.
Key Takeaways
Platform and community domains appeared in 38.25% of recommendation answers and 9.23% of information answers, a ratio of 4.15, across ChatGPT and Google AI Mode.
Brand-owned domains appeared in 73.02% of recommendation answers and 41.70% of information answers, a ratio of 1.75.
The domains that head each kind of answer barely overlap, so each kind of question needs its own list of sites to watch.
Context: 41% of travelers say they are interested in using AI to curate trips, and 61% find trip ideas on social media platforms, up from 35% in 2022.
Context: Google says AI Mode has surpassed one billion monthly users; OpenAI says ChatGPT has more than 900 million weekly active users.
Do Travelers Want AI's Help Planning Trips?
The market numbers describe interest and intent more than settled habit, and it is worth reading them that way.
41% of travelers are interested in using AI to curate trips, according to Booking.com's travel predictions. That is interest, not current use.
Two-thirds (66%) will use technology to make informed decisions and find authentic experiences, from the same Booking.com release. Technology, in that sentence, is broader than AI.
AI Mode queries related to planning grew faster than AI Mode queries overall by 80% over six months, per Google. That covers planning of every kind, not travel alone.
None of these says travelers already plan trips with AI by default. They say the demand is there and rising, which is the reason to check what the engines cite before the habit settles.
How Large Are the Two Engines Measured Here?
Google AI Mode has surpassed one billion monthly users, Google said in June 2026.
ChatGPT has more than 900 million weekly active users, OpenAI said in March 2026.
One figure counts monthly users and the other weekly, so they don't add up or rank against each other. Both are large enough that a travel brand's absence from either engine is a real gap, not a rounding error.
Do Travelers Already Take Trip Ideas From Platforms?
61% of travelers now find trip ideas on social media platforms, up from 35% in 2022, according to Expedia Group's 2025 Traveler Value Index. That is a figure about where people look for inspiration, not about what AI engines cite, and it differs from the platform-and-community share below. It is the reason a platform presence check belongs in a travel team's routine at all.
Platform and Community Sites Show Up Far More on Recommendation Questions
When a traveler asks for a recommendation (where to stay, which tour to book, what to do in a city), platform and community domains appeared in 38.25% of answers. When the traveler asks for information (entry rules, travel insurance, what a points program covers), they appeared in 9.23%. The recommendation rate is 4.15 times the information rate.
Both rates are shares of every answer in their slice, across ChatGPT and Google AI Mode together. The practical consequence is about where a community check belongs. If your prompt list mixes the two kinds of question, the blended rate lands somewhere between 38.25% and 9.23% and describes neither: it understates platforms on the questions where travelers choose, and overstates them on the questions where they only need facts.
Percepture's tourism playbook tells travel brands to "See whether your destination, hotel, attraction, or tour brand appears for real traveler prompts." The data supports half of that advice: the kind of prompt changes which layers of the web show up, which is a good reason to test real traveler prompts of each kind. It doesn't show whether any particular brand appears, because this study didn't measure naming.
Brand-Owned Sites Move With the Question Too
Brand-owned domains appeared in 73.02% of recommendation answers and 41.70% of information answers, a ratio of 1.75. Owned sites appear in most recommendation answers and in a large minority of information answers, and that gap is wide enough that a single owned-presence baseline hides it.
A brand that sees itself cited in about half of AI answers from a mixed prompt list is looking at an average of two different situations. On recommendation questions, owned sites are in nearly three answers out of four; on information questions, in two out of five.
The Tourism Marketing Agency argues that tour operators can improve direct booking visibility "by creating structured destination content, strengthening internal linking and publishing answer focused travel pages aligned with user intent". That may well be sound advice, and nothing here tests it: this study measured which kinds of sites appear alongside answers, not which content formats earn a citation or a booking.
Which Domains Head Each Kind of Answer
This is the supporting table for anyone building a watch list. The shares below are of answers that cited any source, within each slice.
Recommendation questions, the domains covering half of cited answers: kayak.com, getyourguide.com, booking.com, reddit.com.
Recommendation questions, the list covering 80%: kayak.com, getyourguide.com, booking.com, reddit.com, costcotravel.com, squaremouth.com, google.com, jet2holidays.com, priceline.com, cruisedirect.com, allianztravelinsurance.com, wanderlog.com.
Information questions, the domains covering half of cited answers: state.gov, chase.com, thepointsguy.com, transportation.gov, gc.ca, going.com.
Information questions, the list covering 80%: state.gov, chase.com, thepointsguy.com, transportation.gov, gc.ca, going.com, google.com, nerdwallet.com, aa.com, blog.google, gov.uk, sciencedirect.com, aaa.com, canada.ca, lonelyplanet.com, budgetyourtrip.com, cdc.gov, consumerfinance.gov, gosortie.app, iata.org, origins.com.
Cross-coverage: the recommendation list covers 11.02% of information answers that cited any source; the information list covers 28.21% of recommendation answers that cited any source.
Verdict: each kind of question needs its own list.
The Tourism Marketing Agency also describes AI systems that "compare information across multiple digital sources to determine which businesses appear most contextually reliable for a traveller's intent." The lists above are consistent with intent mattering, since the memberships barely overlap, but they show which domains appear, not how an engine chooses them.
For how to build and maintain a list like this, our travel AI visibility measurement playbook walks through the method. Its own separate-lists call was made on pre-trip versus in-destination questions, a different split from the recommendation and information questions measured here.
Run the Two-Slice Check on Your Own Prompts
The finding above only helps if you can see your own two slices. In Qvery, you add and edit the queries you track, so you can keep your recommendation questions and your information questions as two separate sets. Qvery then tracks your visibility, share of voice, and average rank across ChatGPT and Google AI Mode every day, and captures every citation tied to the query and engine that produced it.
From there, ask Qvery Assistant in plain language which of your recommendation queries you appear in, and which domains the engines cited on the ones where you don't. What Qvery won't do is sort citations into this study's platform-and-community and brand-owned labels, or build the coverage lists for you; you read the cited domains and decide.
To see your own two slices, start a free 7-day trial. No credit card is required.
The Limits of These Numbers
These rates describe which kinds of sites appear alongside answers, not what causes an engine to cite them. The other boundaries are worth knowing before you quote them:
No engine ranking. Engine differences are context only in travel; our look at how travel brands show up in AI search covers that ground.
A lean toward ChatGPT. The pooled rates lean toward ChatGPT, which answered each question more often than Google AI Mode did.
No naming measured. Nothing here measures whether a brand was named or recommended.
One question set. The results cover the travel recommendation and information questions we asked in September 2026, not every travel sector, persona, or question set.
No trend line. Earlier collections used a different method, so no comparison over time is drawn.
One unclassified answer. One recommendation answer could not be classified, and counting it either way changes no finding.
Measure Travel Visibility as Two Slices
Track travel recommendation questions and travel information questions as two separate slices, each with its own platform-and-community and brand-owned baseline, and build each slice's domain list with the method in the measurement playbook. One blended number describes neither kind of traveler.
Most travel marketers who check their AI visibility do it with one list of prompts: a few questions about the best hotels in Lisbon, a few about visas for Japan, one average at the end. That average is the problem. We asked ChatGPT and Google AI Mode the recommendation questions and the information questions travelers type, in September 2026, and scored each answer by the kinds of sites it cited.
The answers draw on different sites depending on which kind of question was asked. Platform and community sites showed up in 38.25% of recommendation answers and 9.23% of information answers. Brand-owned sites moved the same way, 73.02% against 41.70%. These are co-occurrence rates, not causes, and nothing here measures whether a particular brand was named.
Key Takeaways
Platform and community domains appeared in 38.25% of recommendation answers and 9.23% of information answers, a ratio of 4.15, across ChatGPT and Google AI Mode.
Brand-owned domains appeared in 73.02% of recommendation answers and 41.70% of information answers, a ratio of 1.75.
The domains that head each kind of answer barely overlap, so each kind of question needs its own list of sites to watch.
Context: 41% of travelers say they are interested in using AI to curate trips, and 61% find trip ideas on social media platforms, up from 35% in 2022.
Context: Google says AI Mode has surpassed one billion monthly users; OpenAI says ChatGPT has more than 900 million weekly active users.
Do Travelers Want AI's Help Planning Trips?
The market numbers describe interest and intent more than settled habit, and it is worth reading them that way.
41% of travelers are interested in using AI to curate trips, according to Booking.com's travel predictions. That is interest, not current use.
Two-thirds (66%) will use technology to make informed decisions and find authentic experiences, from the same Booking.com release. Technology, in that sentence, is broader than AI.
AI Mode queries related to planning grew faster than AI Mode queries overall by 80% over six months, per Google. That covers planning of every kind, not travel alone.
None of these says travelers already plan trips with AI by default. They say the demand is there and rising, which is the reason to check what the engines cite before the habit settles.
How Large Are the Two Engines Measured Here?
Google AI Mode has surpassed one billion monthly users, Google said in June 2026.
ChatGPT has more than 900 million weekly active users, OpenAI said in March 2026.
One figure counts monthly users and the other weekly, so they don't add up or rank against each other. Both are large enough that a travel brand's absence from either engine is a real gap, not a rounding error.
Do Travelers Already Take Trip Ideas From Platforms?
61% of travelers now find trip ideas on social media platforms, up from 35% in 2022, according to Expedia Group's 2025 Traveler Value Index. That is a figure about where people look for inspiration, not about what AI engines cite, and it differs from the platform-and-community share below. It is the reason a platform presence check belongs in a travel team's routine at all.
Platform and Community Sites Show Up Far More on Recommendation Questions
When a traveler asks for a recommendation (where to stay, which tour to book, what to do in a city), platform and community domains appeared in 38.25% of answers. When the traveler asks for information (entry rules, travel insurance, what a points program covers), they appeared in 9.23%. The recommendation rate is 4.15 times the information rate.
Both rates are shares of every answer in their slice, across ChatGPT and Google AI Mode together. The practical consequence is about where a community check belongs. If your prompt list mixes the two kinds of question, the blended rate lands somewhere between 38.25% and 9.23% and describes neither: it understates platforms on the questions where travelers choose, and overstates them on the questions where they only need facts.
Percepture's tourism playbook tells travel brands to "See whether your destination, hotel, attraction, or tour brand appears for real traveler prompts." The data supports half of that advice: the kind of prompt changes which layers of the web show up, which is a good reason to test real traveler prompts of each kind. It doesn't show whether any particular brand appears, because this study didn't measure naming.
Brand-Owned Sites Move With the Question Too
Brand-owned domains appeared in 73.02% of recommendation answers and 41.70% of information answers, a ratio of 1.75. Owned sites appear in most recommendation answers and in a large minority of information answers, and that gap is wide enough that a single owned-presence baseline hides it.
A brand that sees itself cited in about half of AI answers from a mixed prompt list is looking at an average of two different situations. On recommendation questions, owned sites are in nearly three answers out of four; on information questions, in two out of five.
The Tourism Marketing Agency argues that tour operators can improve direct booking visibility "by creating structured destination content, strengthening internal linking and publishing answer focused travel pages aligned with user intent". That may well be sound advice, and nothing here tests it: this study measured which kinds of sites appear alongside answers, not which content formats earn a citation or a booking.
Which Domains Head Each Kind of Answer
This is the supporting table for anyone building a watch list. The shares below are of answers that cited any source, within each slice.
Recommendation questions, the domains covering half of cited answers: kayak.com, getyourguide.com, booking.com, reddit.com.
Recommendation questions, the list covering 80%: kayak.com, getyourguide.com, booking.com, reddit.com, costcotravel.com, squaremouth.com, google.com, jet2holidays.com, priceline.com, cruisedirect.com, allianztravelinsurance.com, wanderlog.com.
Information questions, the domains covering half of cited answers: state.gov, chase.com, thepointsguy.com, transportation.gov, gc.ca, going.com.
Information questions, the list covering 80%: state.gov, chase.com, thepointsguy.com, transportation.gov, gc.ca, going.com, google.com, nerdwallet.com, aa.com, blog.google, gov.uk, sciencedirect.com, aaa.com, canada.ca, lonelyplanet.com, budgetyourtrip.com, cdc.gov, consumerfinance.gov, gosortie.app, iata.org, origins.com.
Cross-coverage: the recommendation list covers 11.02% of information answers that cited any source; the information list covers 28.21% of recommendation answers that cited any source.
Verdict: each kind of question needs its own list.
The Tourism Marketing Agency also describes AI systems that "compare information across multiple digital sources to determine which businesses appear most contextually reliable for a traveller's intent." The lists above are consistent with intent mattering, since the memberships barely overlap, but they show which domains appear, not how an engine chooses them.
For how to build and maintain a list like this, our travel AI visibility measurement playbook walks through the method. Its own separate-lists call was made on pre-trip versus in-destination questions, a different split from the recommendation and information questions measured here.
Run the Two-Slice Check on Your Own Prompts
The finding above only helps if you can see your own two slices. In Qvery, you add and edit the queries you track, so you can keep your recommendation questions and your information questions as two separate sets. Qvery then tracks your visibility, share of voice, and average rank across ChatGPT and Google AI Mode every day, and captures every citation tied to the query and engine that produced it.
From there, ask Qvery Assistant in plain language which of your recommendation queries you appear in, and which domains the engines cited on the ones where you don't. What Qvery won't do is sort citations into this study's platform-and-community and brand-owned labels, or build the coverage lists for you; you read the cited domains and decide.
To see your own two slices, start a free 7-day trial. No credit card is required.
The Limits of These Numbers
These rates describe which kinds of sites appear alongside answers, not what causes an engine to cite them. The other boundaries are worth knowing before you quote them:
No engine ranking. Engine differences are context only in travel; our look at how travel brands show up in AI search covers that ground.
A lean toward ChatGPT. The pooled rates lean toward ChatGPT, which answered each question more often than Google AI Mode did.
No naming measured. Nothing here measures whether a brand was named or recommended.
One question set. The results cover the travel recommendation and information questions we asked in September 2026, not every travel sector, persona, or question set.
No trend line. Earlier collections used a different method, so no comparison over time is drawn.
One unclassified answer. One recommendation answer could not be classified, and counting it either way changes no finding.
Measure Travel Visibility as Two Slices
Track travel recommendation questions and travel information questions as two separate slices, each with its own platform-and-community and brand-owned baseline, and build each slice's domain list with the method in the measurement playbook. One blended number describes neither kind of traveler.
Most travel marketers who check their AI visibility do it with one list of prompts: a few questions about the best hotels in Lisbon, a few about visas for Japan, one average at the end. That average is the problem. We asked ChatGPT and Google AI Mode the recommendation questions and the information questions travelers type, in September 2026, and scored each answer by the kinds of sites it cited.
The answers draw on different sites depending on which kind of question was asked. Platform and community sites showed up in 38.25% of recommendation answers and 9.23% of information answers. Brand-owned sites moved the same way, 73.02% against 41.70%. These are co-occurrence rates, not causes, and nothing here measures whether a particular brand was named.
Key Takeaways
Platform and community domains appeared in 38.25% of recommendation answers and 9.23% of information answers, a ratio of 4.15, across ChatGPT and Google AI Mode.
Brand-owned domains appeared in 73.02% of recommendation answers and 41.70% of information answers, a ratio of 1.75.
The domains that head each kind of answer barely overlap, so each kind of question needs its own list of sites to watch.
Context: 41% of travelers say they are interested in using AI to curate trips, and 61% find trip ideas on social media platforms, up from 35% in 2022.
Context: Google says AI Mode has surpassed one billion monthly users; OpenAI says ChatGPT has more than 900 million weekly active users.
Do Travelers Want AI's Help Planning Trips?
The market numbers describe interest and intent more than settled habit, and it is worth reading them that way.
41% of travelers are interested in using AI to curate trips, according to Booking.com's travel predictions. That is interest, not current use.
Two-thirds (66%) will use technology to make informed decisions and find authentic experiences, from the same Booking.com release. Technology, in that sentence, is broader than AI.
AI Mode queries related to planning grew faster than AI Mode queries overall by 80% over six months, per Google. That covers planning of every kind, not travel alone.
None of these says travelers already plan trips with AI by default. They say the demand is there and rising, which is the reason to check what the engines cite before the habit settles.
How Large Are the Two Engines Measured Here?
Google AI Mode has surpassed one billion monthly users, Google said in June 2026.
ChatGPT has more than 900 million weekly active users, OpenAI said in March 2026.
One figure counts monthly users and the other weekly, so they don't add up or rank against each other. Both are large enough that a travel brand's absence from either engine is a real gap, not a rounding error.
Do Travelers Already Take Trip Ideas From Platforms?
61% of travelers now find trip ideas on social media platforms, up from 35% in 2022, according to Expedia Group's 2025 Traveler Value Index. That is a figure about where people look for inspiration, not about what AI engines cite, and it differs from the platform-and-community share below. It is the reason a platform presence check belongs in a travel team's routine at all.
Platform and Community Sites Show Up Far More on Recommendation Questions
When a traveler asks for a recommendation (where to stay, which tour to book, what to do in a city), platform and community domains appeared in 38.25% of answers. When the traveler asks for information (entry rules, travel insurance, what a points program covers), they appeared in 9.23%. The recommendation rate is 4.15 times the information rate.
Both rates are shares of every answer in their slice, across ChatGPT and Google AI Mode together. The practical consequence is about where a community check belongs. If your prompt list mixes the two kinds of question, the blended rate lands somewhere between 38.25% and 9.23% and describes neither: it understates platforms on the questions where travelers choose, and overstates them on the questions where they only need facts.
Percepture's tourism playbook tells travel brands to "See whether your destination, hotel, attraction, or tour brand appears for real traveler prompts." The data supports half of that advice: the kind of prompt changes which layers of the web show up, which is a good reason to test real traveler prompts of each kind. It doesn't show whether any particular brand appears, because this study didn't measure naming.
Brand-Owned Sites Move With the Question Too
Brand-owned domains appeared in 73.02% of recommendation answers and 41.70% of information answers, a ratio of 1.75. Owned sites appear in most recommendation answers and in a large minority of information answers, and that gap is wide enough that a single owned-presence baseline hides it.
A brand that sees itself cited in about half of AI answers from a mixed prompt list is looking at an average of two different situations. On recommendation questions, owned sites are in nearly three answers out of four; on information questions, in two out of five.
The Tourism Marketing Agency argues that tour operators can improve direct booking visibility "by creating structured destination content, strengthening internal linking and publishing answer focused travel pages aligned with user intent". That may well be sound advice, and nothing here tests it: this study measured which kinds of sites appear alongside answers, not which content formats earn a citation or a booking.
Which Domains Head Each Kind of Answer
This is the supporting table for anyone building a watch list. The shares below are of answers that cited any source, within each slice.
Recommendation questions, the domains covering half of cited answers: kayak.com, getyourguide.com, booking.com, reddit.com.
Recommendation questions, the list covering 80%: kayak.com, getyourguide.com, booking.com, reddit.com, costcotravel.com, squaremouth.com, google.com, jet2holidays.com, priceline.com, cruisedirect.com, allianztravelinsurance.com, wanderlog.com.
Information questions, the domains covering half of cited answers: state.gov, chase.com, thepointsguy.com, transportation.gov, gc.ca, going.com.
Information questions, the list covering 80%: state.gov, chase.com, thepointsguy.com, transportation.gov, gc.ca, going.com, google.com, nerdwallet.com, aa.com, blog.google, gov.uk, sciencedirect.com, aaa.com, canada.ca, lonelyplanet.com, budgetyourtrip.com, cdc.gov, consumerfinance.gov, gosortie.app, iata.org, origins.com.
Cross-coverage: the recommendation list covers 11.02% of information answers that cited any source; the information list covers 28.21% of recommendation answers that cited any source.
Verdict: each kind of question needs its own list.
The Tourism Marketing Agency also describes AI systems that "compare information across multiple digital sources to determine which businesses appear most contextually reliable for a traveller's intent." The lists above are consistent with intent mattering, since the memberships barely overlap, but they show which domains appear, not how an engine chooses them.
For how to build and maintain a list like this, our travel AI visibility measurement playbook walks through the method. Its own separate-lists call was made on pre-trip versus in-destination questions, a different split from the recommendation and information questions measured here.
Run the Two-Slice Check on Your Own Prompts
The finding above only helps if you can see your own two slices. In Qvery, you add and edit the queries you track, so you can keep your recommendation questions and your information questions as two separate sets. Qvery then tracks your visibility, share of voice, and average rank across ChatGPT and Google AI Mode every day, and captures every citation tied to the query and engine that produced it.
From there, ask Qvery Assistant in plain language which of your recommendation queries you appear in, and which domains the engines cited on the ones where you don't. What Qvery won't do is sort citations into this study's platform-and-community and brand-owned labels, or build the coverage lists for you; you read the cited domains and decide.
To see your own two slices, start a free 7-day trial. No credit card is required.
The Limits of These Numbers
These rates describe which kinds of sites appear alongside answers, not what causes an engine to cite them. The other boundaries are worth knowing before you quote them:
No engine ranking. Engine differences are context only in travel; our look at how travel brands show up in AI search covers that ground.
A lean toward ChatGPT. The pooled rates lean toward ChatGPT, which answered each question more often than Google AI Mode did.
No naming measured. Nothing here measures whether a brand was named or recommended.
One question set. The results cover the travel recommendation and information questions we asked in September 2026, not every travel sector, persona, or question set.
No trend line. Earlier collections used a different method, so no comparison over time is drawn.
One unclassified answer. One recommendation answer could not be classified, and counting it either way changes no finding.
Measure Travel Visibility as Two Slices
Track travel recommendation questions and travel information questions as two separate slices, each with its own platform-and-community and brand-owned baseline, and build each slice's domain list with the method in the measurement playbook. One blended number describes neither kind of traveler.

© 2026 Qvery AI OÜ