By
Vlad Shvets
How To Measure Ecommerce Share Of Voice
We asked ChatGPT the same shopping questions over and over. Across run pairs of an identical query, the cited sources overlapped at 0.3329. What that means for measuring share of voice, and the second number that keeps it worth tracking.
We asked ChatGPT the same shopping questions over and over. Across run pairs of an identical query, the cited sources overlapped at 0.3329. What that means for measuring share of voice, and the second number that keeps it worth tracking.
We asked ChatGPT the same shopping questions over and over. Across run pairs of an identical query, the cited sources overlapped at 0.3329. What that means for measuring share of voice, and the second number that keeps it worth tracking.
We asked ChatGPT the same shopping question over and over inside a single collection window, changing nothing between runs, then compared which domains it cited each time.
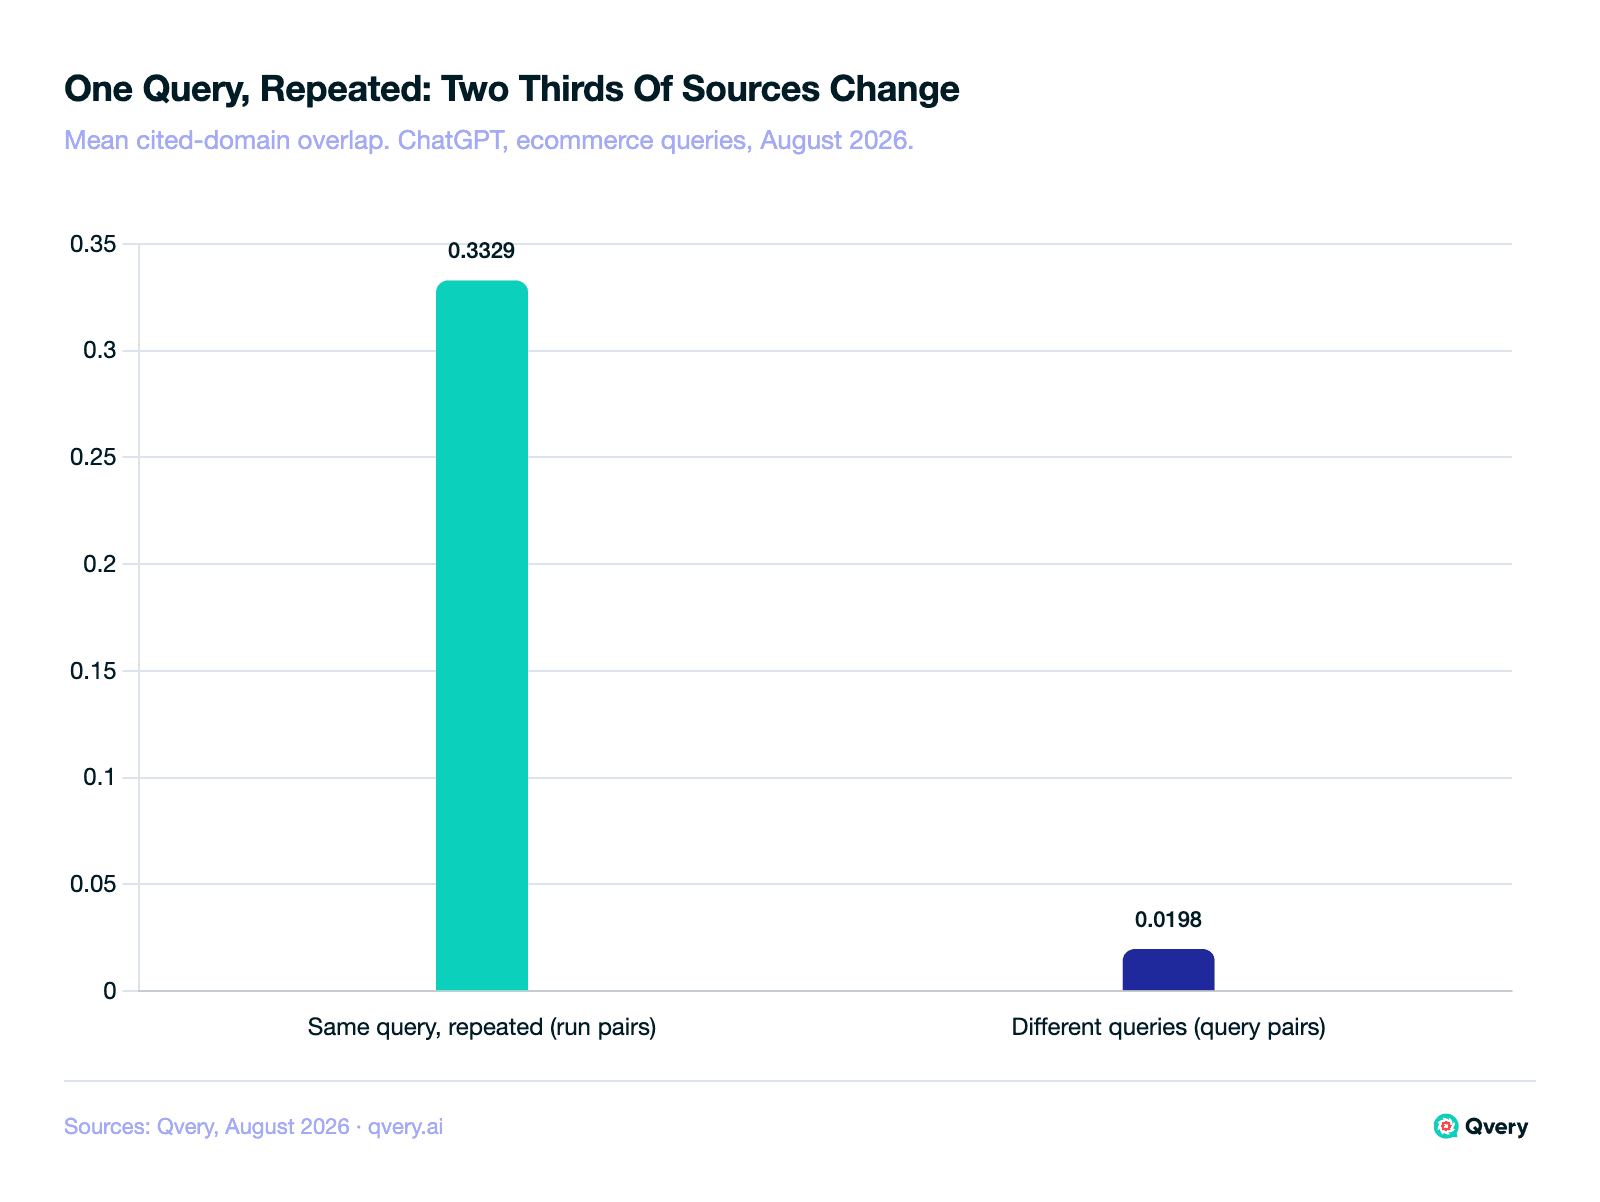
Across pairs of runs of an identical query, the cited-domain sets overlapped at 0.3329. Two thirds of the sources moved.
No query in the set held its source list steady across repeats.
So if your read on whether ChatGPT recommends you comes from typing your money question into the box once and looking at what came back, you have a sample.
One run captures roughly a third of what one query can return.
What this records is which domains were cited. It does not establish why any one of them was chosen, and nothing in the design tested that.
Those figures come from a targeted set of ecommerce shopping queries we ran on ChatGPT and Google AI Mode, August 2026. Read them as direction, not as a census.
What follows is what to do instead, and the second number that keeps share of voice worth tracking.
The Same Question Returns A Different Source List Every Time
The measurement is a repeat test. Take one query, ask it repeatedly on ChatGPT inside one window, then compare the set of domains cited in each run against the set cited in every other run of the same query. Overlap is measured over those sets.
The denominator is run pairs, not runs, and that distinction carries through every figure here. Every two runs of a query form one pair, and the average is taken across all of them.
Averaged that way, the overlap is 0.3329. Two runs of an identical question agree on about a third of the sources they cite and disagree on the rest.
Nothing about the question changed between those runs. Same wording, same engine, same window, same country held constant throughout. Whatever moves sits in the retrieval step.
The mechanism is worth saying plainly, because it is less dramatic than it sounds. On a shopping question ChatGPT runs a live search, reads a handful of the pages that come back, and writes the answer from those. This is the same retrieval step that decides which products reach a shopping answer at all.
Which handful it reads is settled per run. Each run works from a slightly different stack of pages, and that stack is the variable.
A single answer, then, is one draw.
When your brand is missing from it, the absence is real for that run and says very little on its own. When your brand is present, the same caution applies in the other direction.
This is a ChatGPT figure. The Google AI Mode leg of the same collection did not produce enough repeats for a comparable stability number, so nothing here claims the two engines behave alike on this.
There Is No Calmer Question To Track
Every query we tested disagreed with itself at least once, and none returned a stable set of cited sources across its repeats. Instability here is the general case, not a property of a few volatile questions.
We split the set into two families before collecting anything. One holds category-discovery questions, from bare ones like "best air fryers" to constrained ones like "which power banks hold a charge long enough for a weekend backpacking trip without power outlets."
The other holds brand-evaluation questions, such as "is a merino base layer worth it for winter commuting" or "which electric kettle pours accurately for pour-over coffee."
The two families landed at 0.3561 and 0.3096. That gap is too small to build anything on, which is itself worth knowing: the instability is a property of the measurement, and it turns up whatever you ask.
You cannot pick your way around this. Every shape of question we tried moved by about the same amount, so a set built to look stable will not be.
The wobble is the same size for your competitors, so it favours nobody. It only punishes whoever measures once.
The rule that follows is dull and worth following anyway. When your brand vanishes from an answer it appeared in last week, re-ask before you open a content ticket. A single disappearance is no evidence that anything about your content changed.
The Noise Is Real, And The Signal Is Bigger
The second number is the one that rescues the metric. We ran the same overlap comparison between different queries inside the same family, on a different denominator: query pairs rather than run pairs. That figure is 0.0198.
Read the two carefully, because they do not share a denominator. Repeated runs of one question overlap at 0.3329 across run pairs. Two different questions overlap at 0.0198 across query pairs.
The distance between them is what makes tracking possible at all. If one question asked twice looked about as different as two unrelated questions, a share-of-voice figure would be mostly noise and there would be nothing to trend.
The data says otherwise, and not by a small margin.
A share of voice figure and a spot check are not the same measurement at different sample sizes. One is a rate; the other is an anecdote with a percent sign.
There is a reading of all this to avoid, which is that the engines are random and therefore not worth working on. The between-query figure says the opposite.
If retrieval were noise all the way down, two unrelated questions would look about as different from each other as one question does from itself. They are nowhere near that.
What you publish, and which questions it answers, moves the number far more than the wobble. The wobble is a reason to measure more carefully, not a reason to measure less.
What moved, run to run, is a read off the citation list, which is where the churn is visible at all.
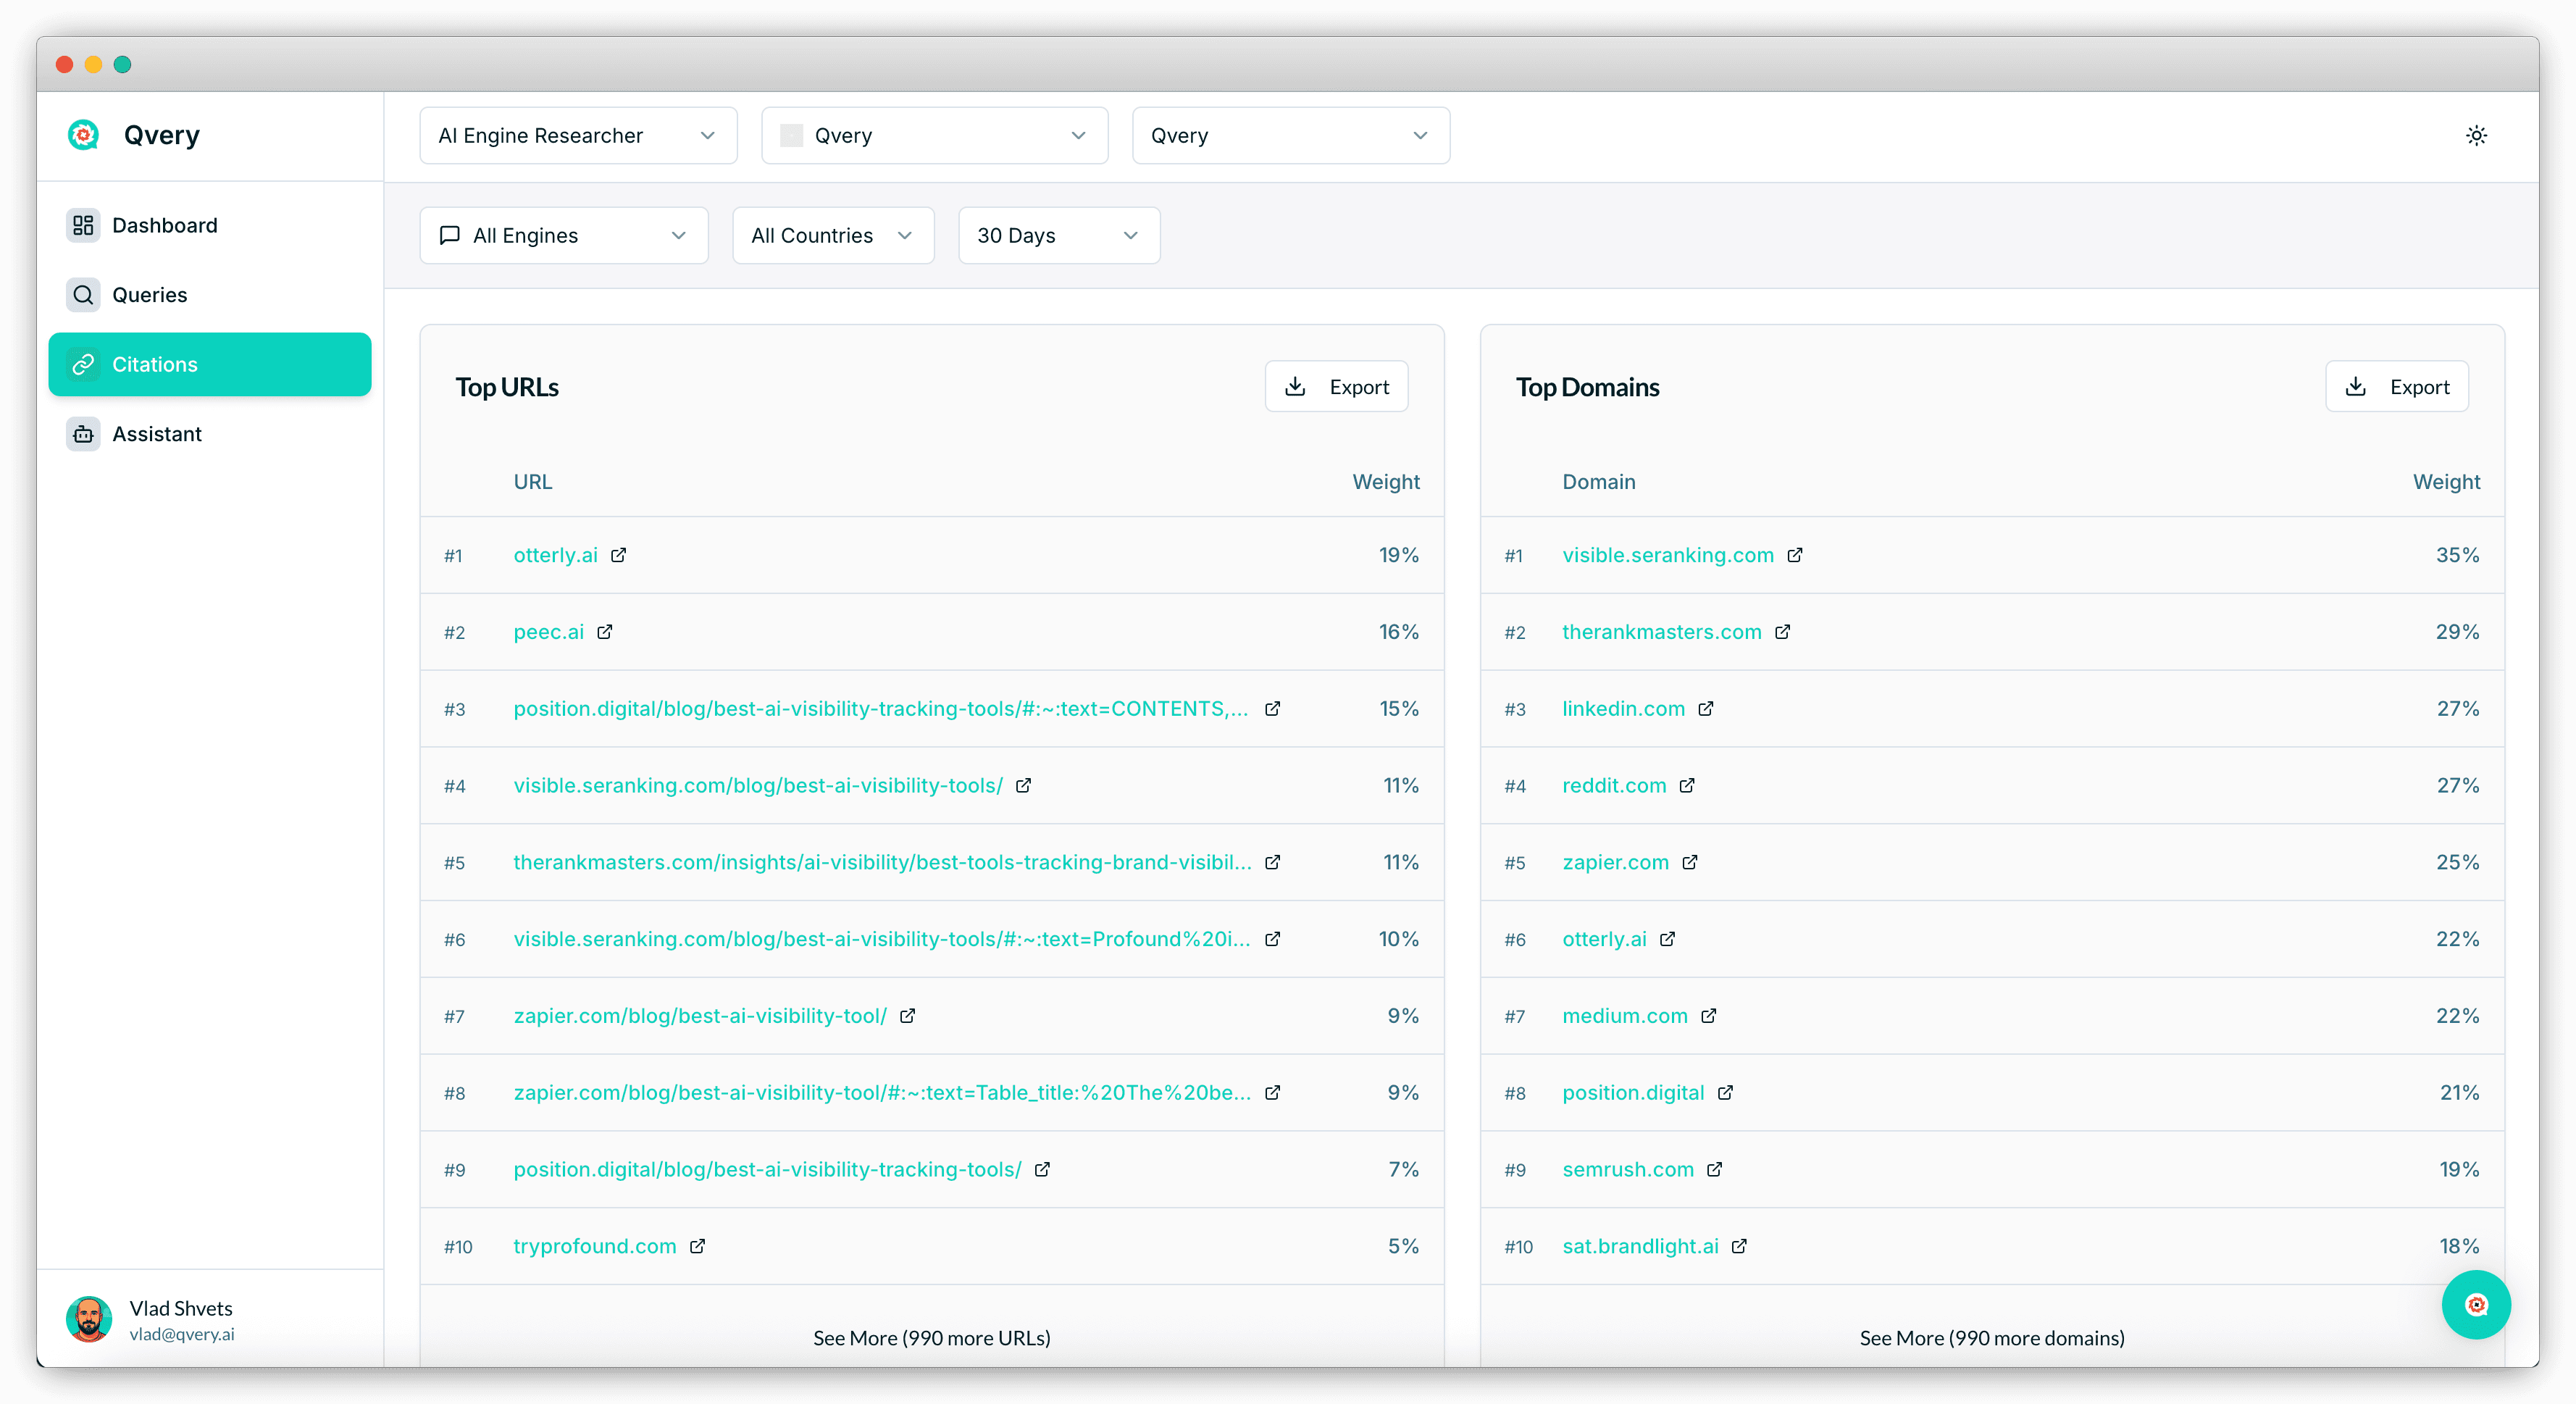
The account in that view is not an ecommerce brand, and the ranked-weight read is the part that transfers.
Both halves of this matter. The instability kills the spot check. The distance between the two figures says share of voice is worth measuring, as long as the number you report is built from repeats, not from one look.
That is also the defensible version of a claim vendors in this space make constantly, ourselves included. Repetition is the step that turns a reading into a number, and this probe gives it a size.
Build The Set From What Shoppers Type, Then Repeat It
The query set is the part most teams get wrong first, so start there. Shoppers do not type your category page's title. They type the constraint that is bothering them.
Compare "best wireless earbuds" with "what blender should I get for making smoothies every morning for a family of four under $150." Both are real questions from this probe.
The second carries a budget, a use case, a frequency, and a household size. That is the shape most buying questions arrive in, and a set made only of bare category phrases will never see it.
So the set has five properties, and only the last one is optional:
Both families: bare category questions tell you whether you exist in the broad answer, constrained ones whether you survive contact with a real requirement.
Both engines: your buyers use both, so a set you only ask on one describes half the picture.
Everything else held still: we held country constant on purpose, because country is a confound when the thing being measured is variance.
Repeats, always: a query asked once has given you one draw, and the reading you want is the average across several.
Frozen strings: rewrite the wording and you have started a new series.
A tracked query is that exact string with its own run history, which is what makes an average possible at all.
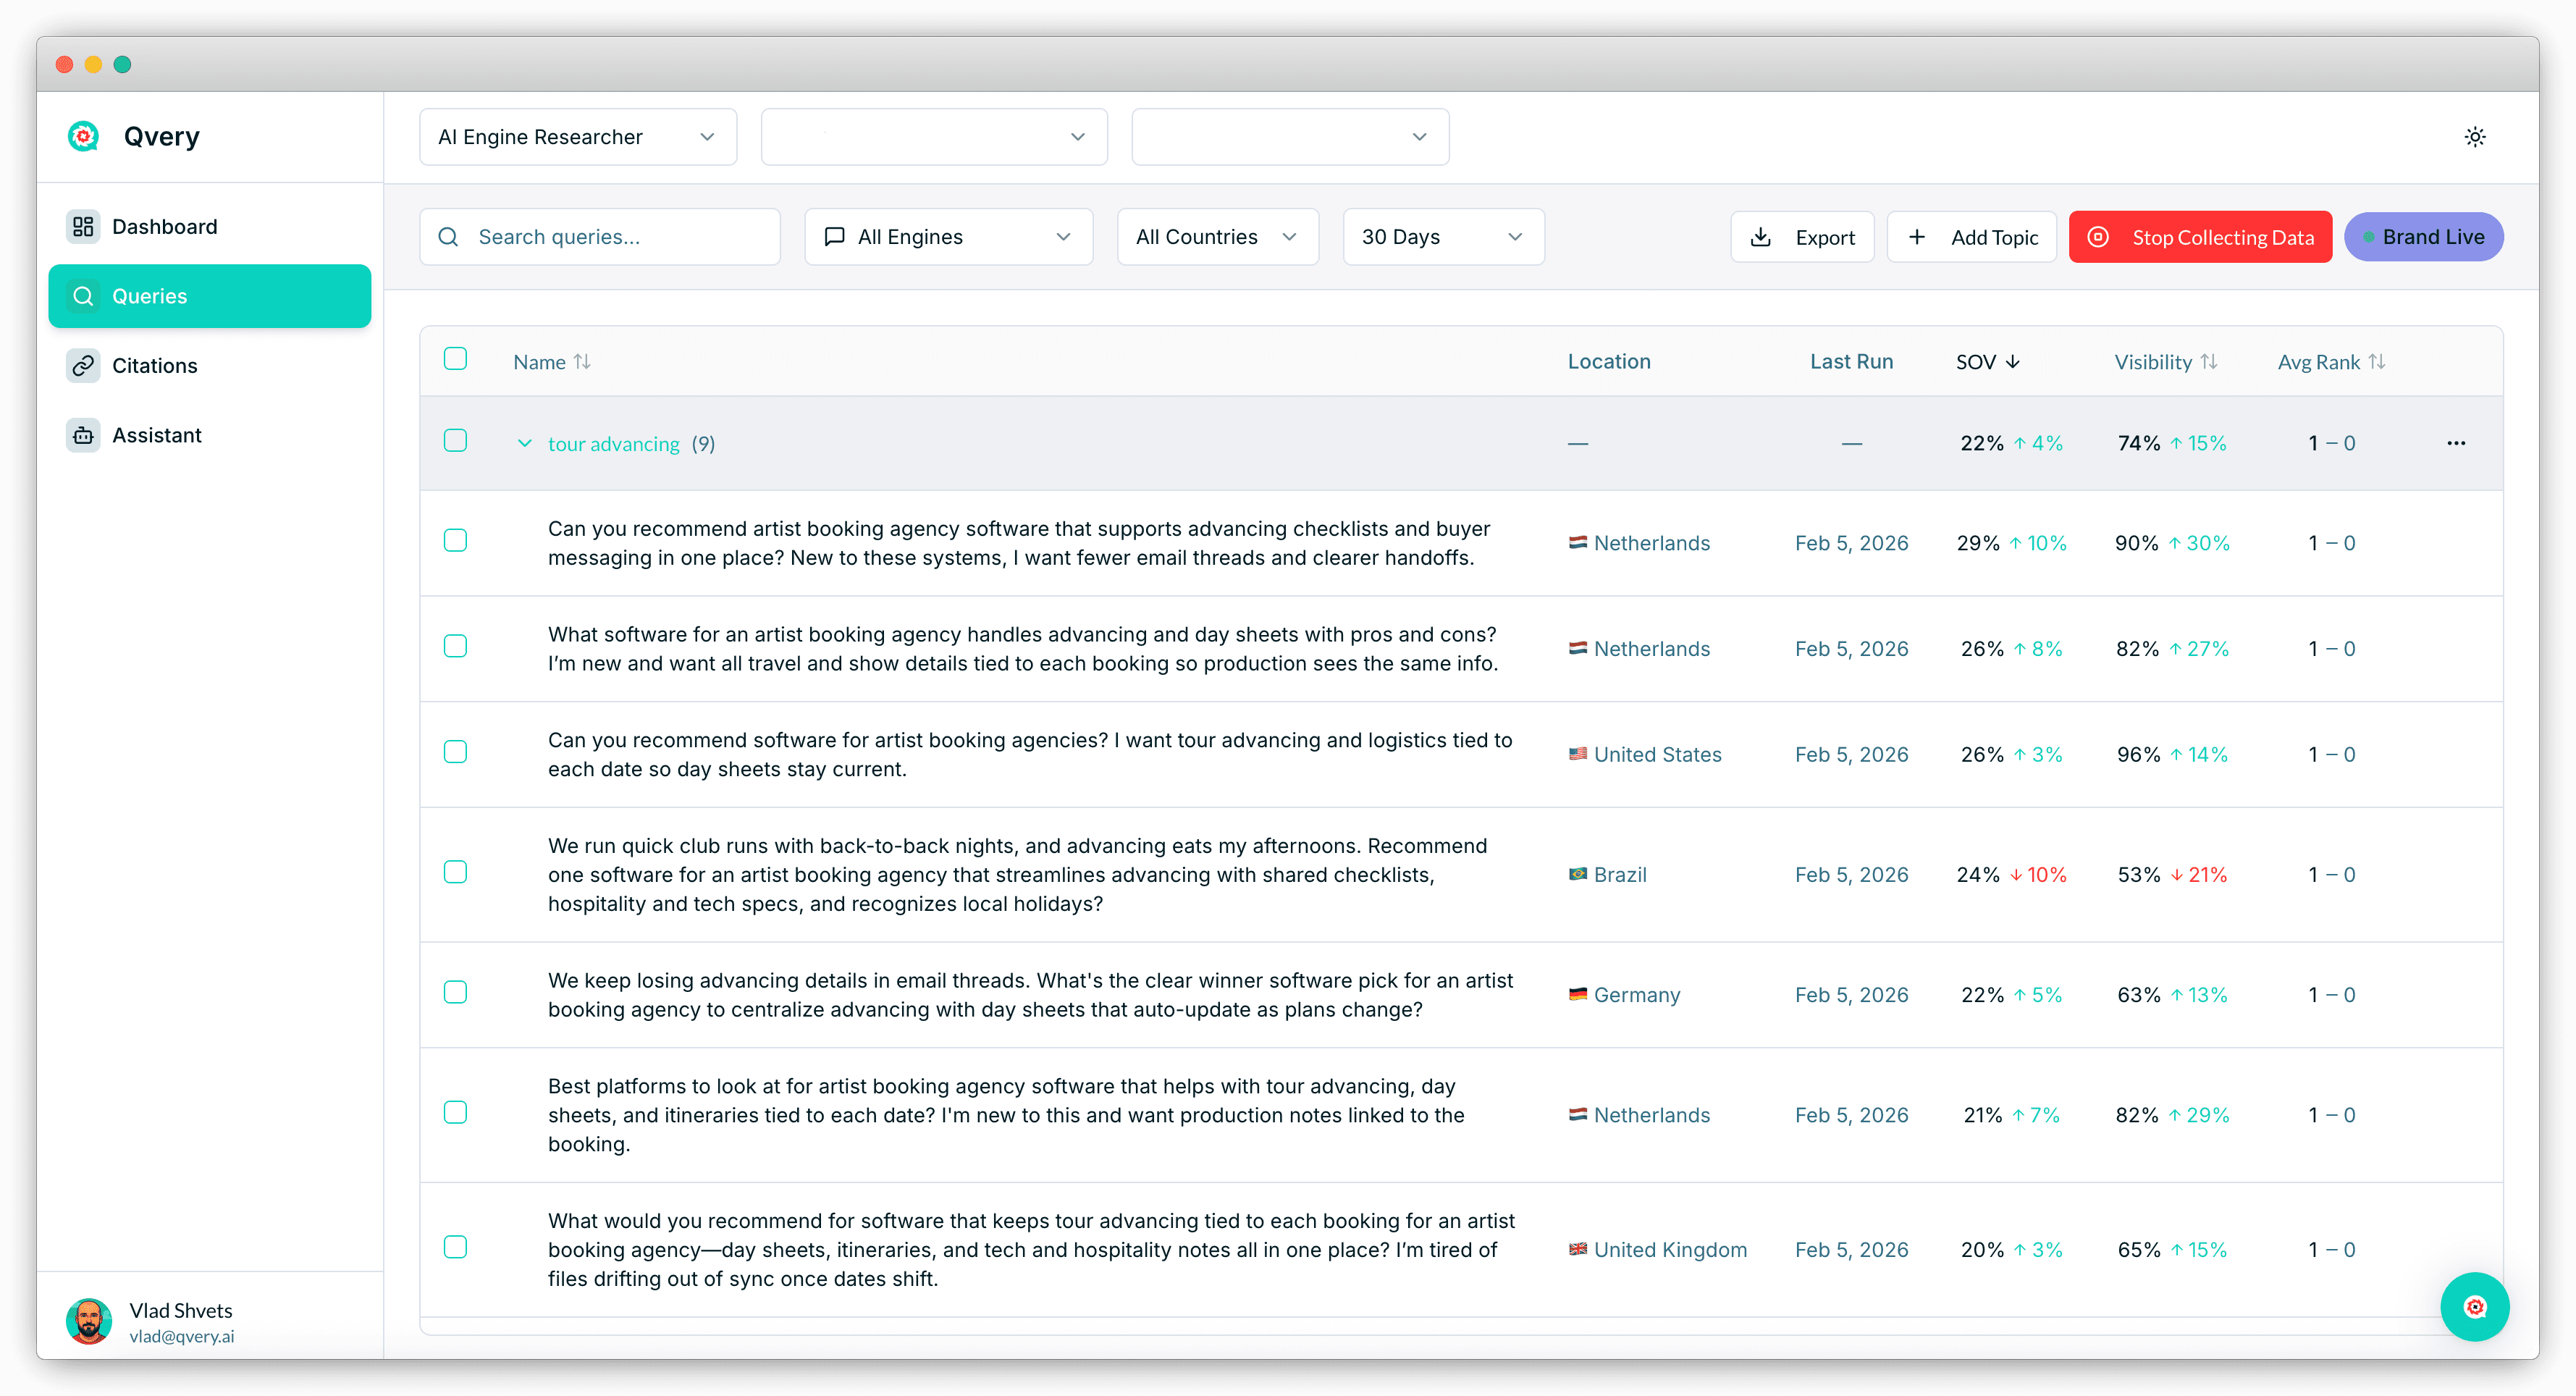
How many repeats is a judgment call. Start with a schedule you will keep, and add repeats on the questions closest to your revenue. Spreading them evenly across a long list buys less.
Then aggregate across runs. Never compute the share inside a single one.
For each query, count the share of its runs where you appear, and report that share with the number of runs behind it. Do the same for each competitor and you have a share of voice built the way this data says it has to be built.
Resist reporting the most recent answer. It is one draw, and on its own it is the least informative row in the file.
One thing worth watching, flagged as judgment because the probe does not measure it: the queries where you show up in some runs and not others are the ones sitting on a threshold.
A query you never appear in and a query you appear in half the time are different problems. The second is closer to won than it looks.
That threshold group is the cheapest list you will build this quarter, and it only exists if you kept the runs.
Say What Your Number Is Made Of
A visibility figure without its construction does not travel, and most disagreements about one turn out to be disagreements about two numbers that were built differently. Four labels fix that:
Which engine produced it, since the two were not measured the same way here.
What window it covers.
Which denominator it uses: all runs, or only the answers that cited any source.
How many repeats sit behind it.
The last one is the label nobody writes down, and it decides whether two reports can be compared at all.
The same visibility figure from a single check and from a fortnight of repeats are not the same claim. Only one of them survives being asked how it was built.
The comparison case is worse than the single-brand case, and it is the one most reports are built on.
If your figure is one draw and your competitor's figure is one draw, the gap between them carries both wobbles at once. A small lead assembled that way will not survive being re-run.
Two brands measured across the same repeats, on the same queries, in the same window, is a comparison. Two brands each glanced at once is two guesses placed next to each other.
Cadence changes for the same reason. A weekly report built from daily runs is an average, and it steadies as the weeks accumulate. A weekly report built from one check every Monday is a string of single draws, and it will look volatile forever no matter how good your content gets.
The definitions are a separate question from the construction. If you want what visibility, share of voice, and average rank each measure, we wrote that up already.
Build The Repeats Into The Report In Qvery
Everything above can be done by hand. It is also the kind of work that stops happening by week three, which is roughly why Qvery exists in the shape it does.
Put your ten highest-value shopping questions in as tracked queries and leave them alone. Qvery asks them daily on ChatGPT and Google AI Mode and keeps every citation, tied to the query and the engine that produced it, so the repetition happens by default.
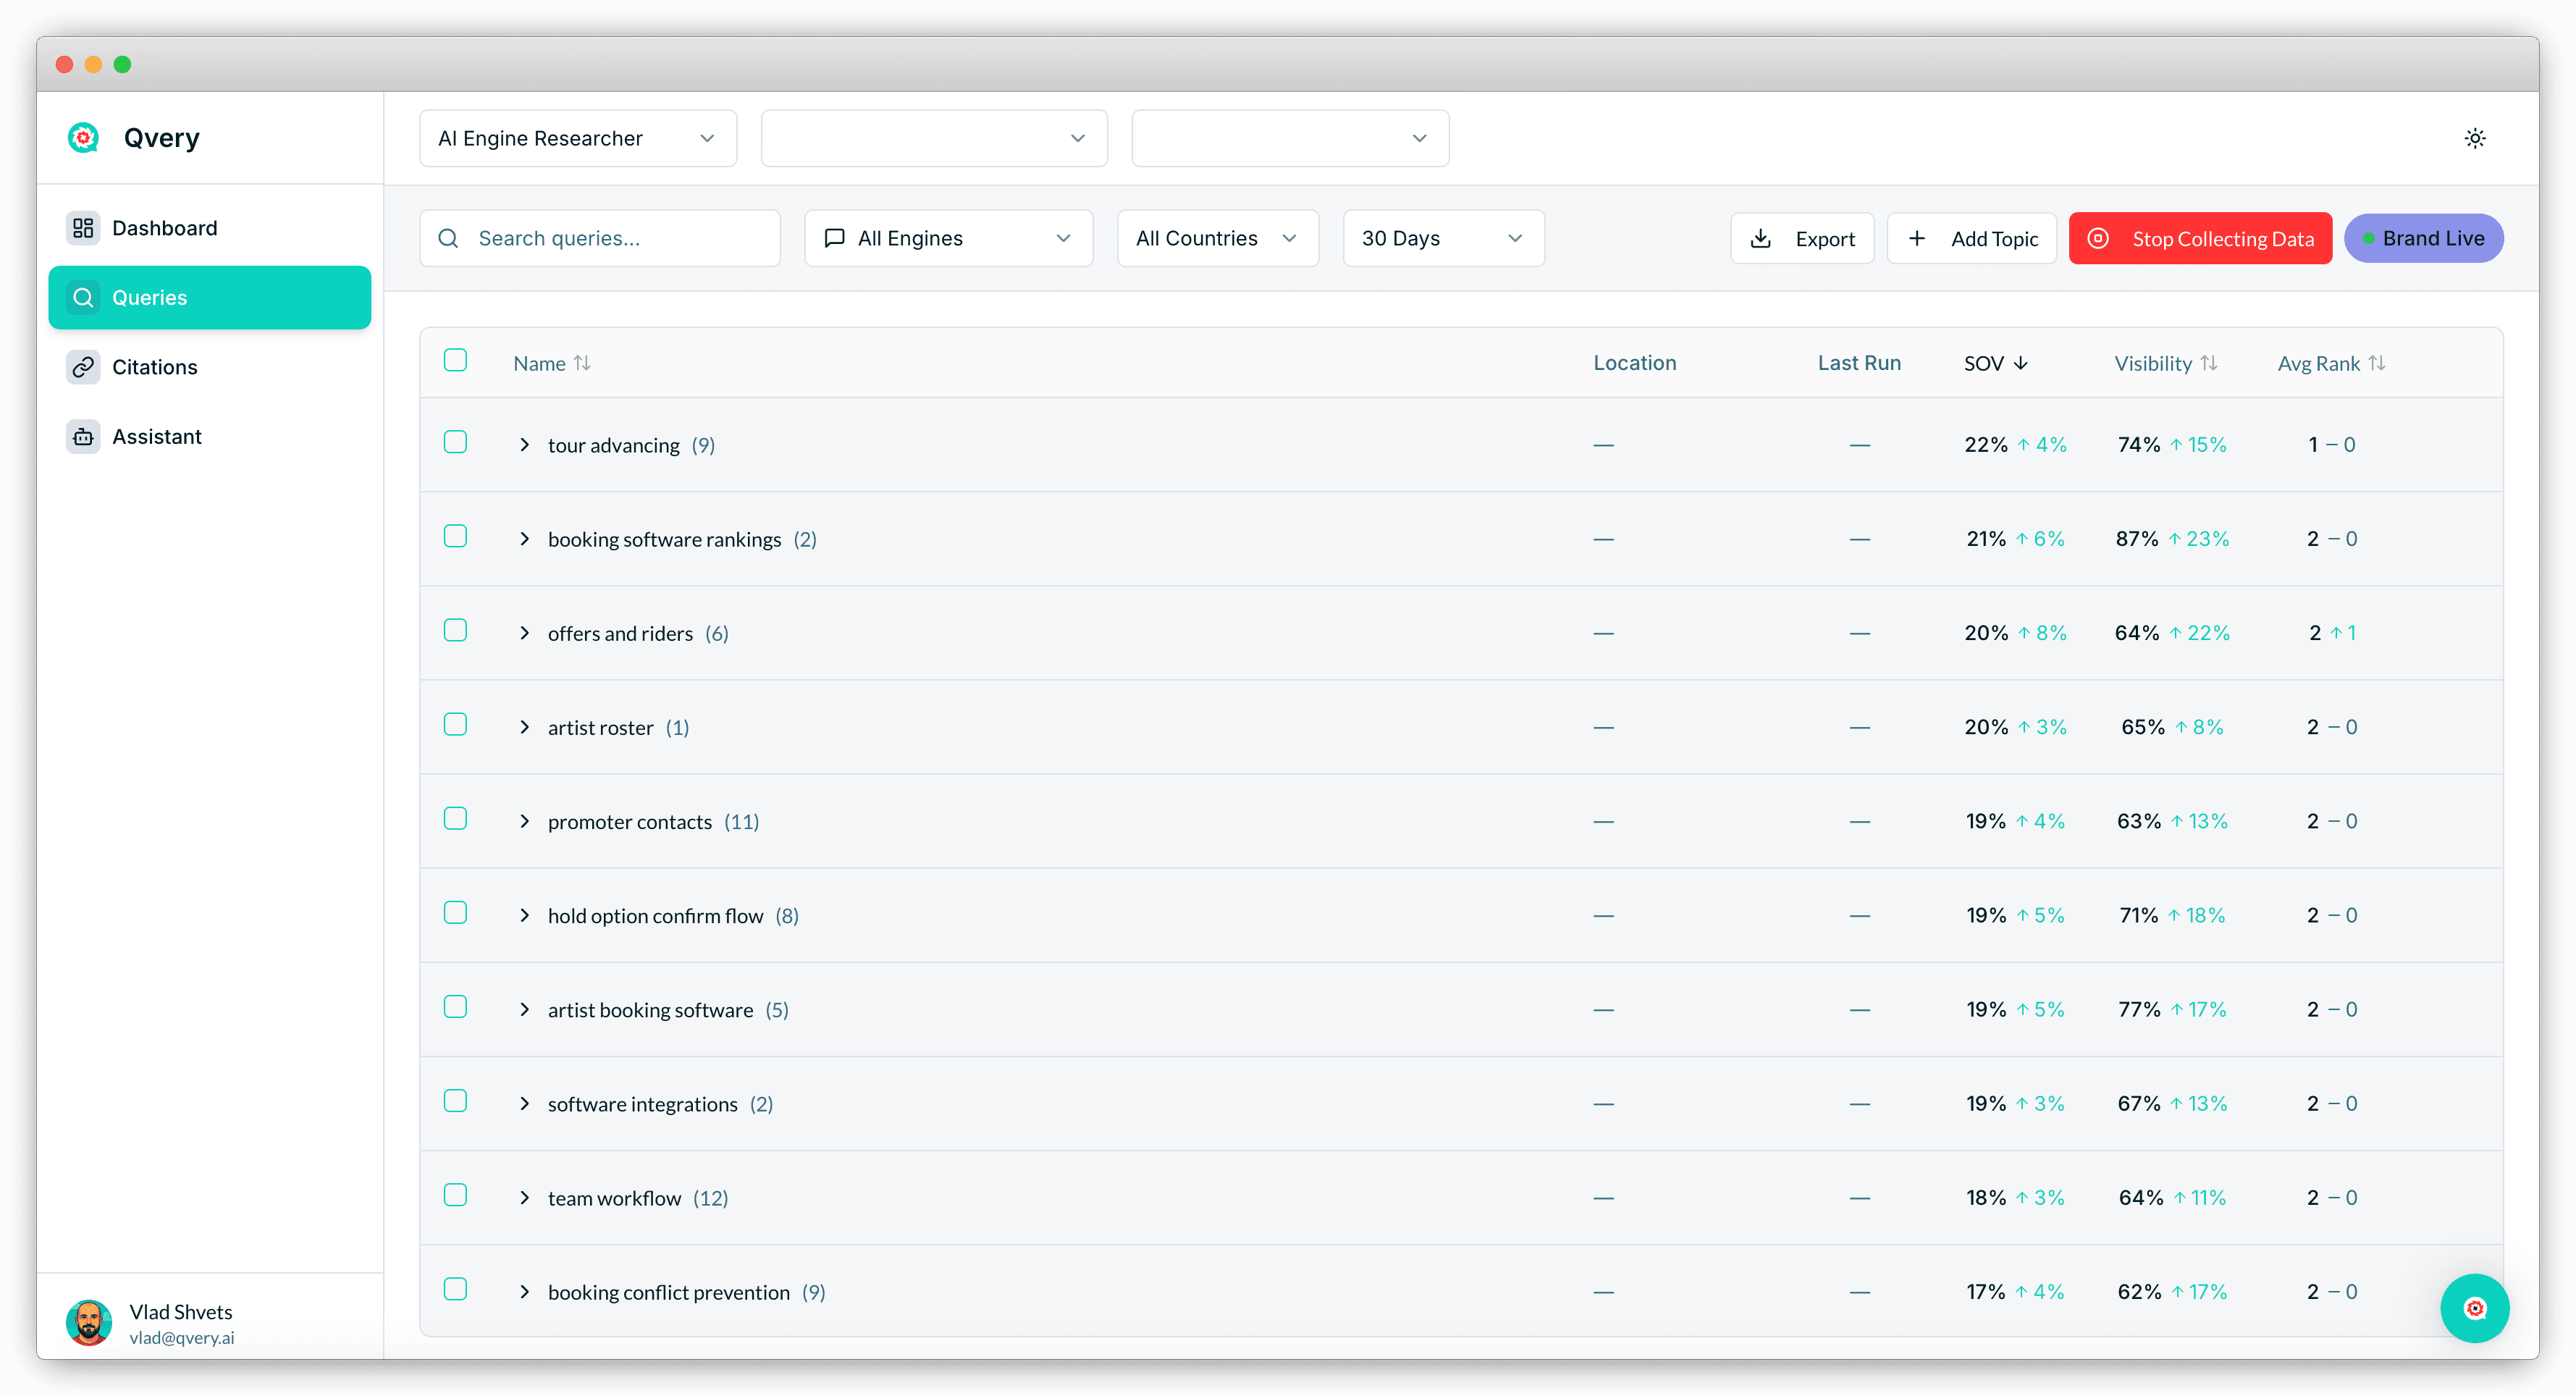
Then read it the way this article says a number has to be built:
Share of voice per topic: not per answer, so the figure is already an average across runs rather than a reading off the latest one.
The period filter: a longer window is more repeats, which is the same thing as a steadier number.
The engine filter: since the two engines were not measured the same way here, and a blended figure hides which one moved.
Per-query visibility: the queries you appear in on some runs and not others, which is the threshold list worth working on.
In Qvery Assistant you can ask for the same cut in plain language, including which of your tracked queries you never appear in at all.
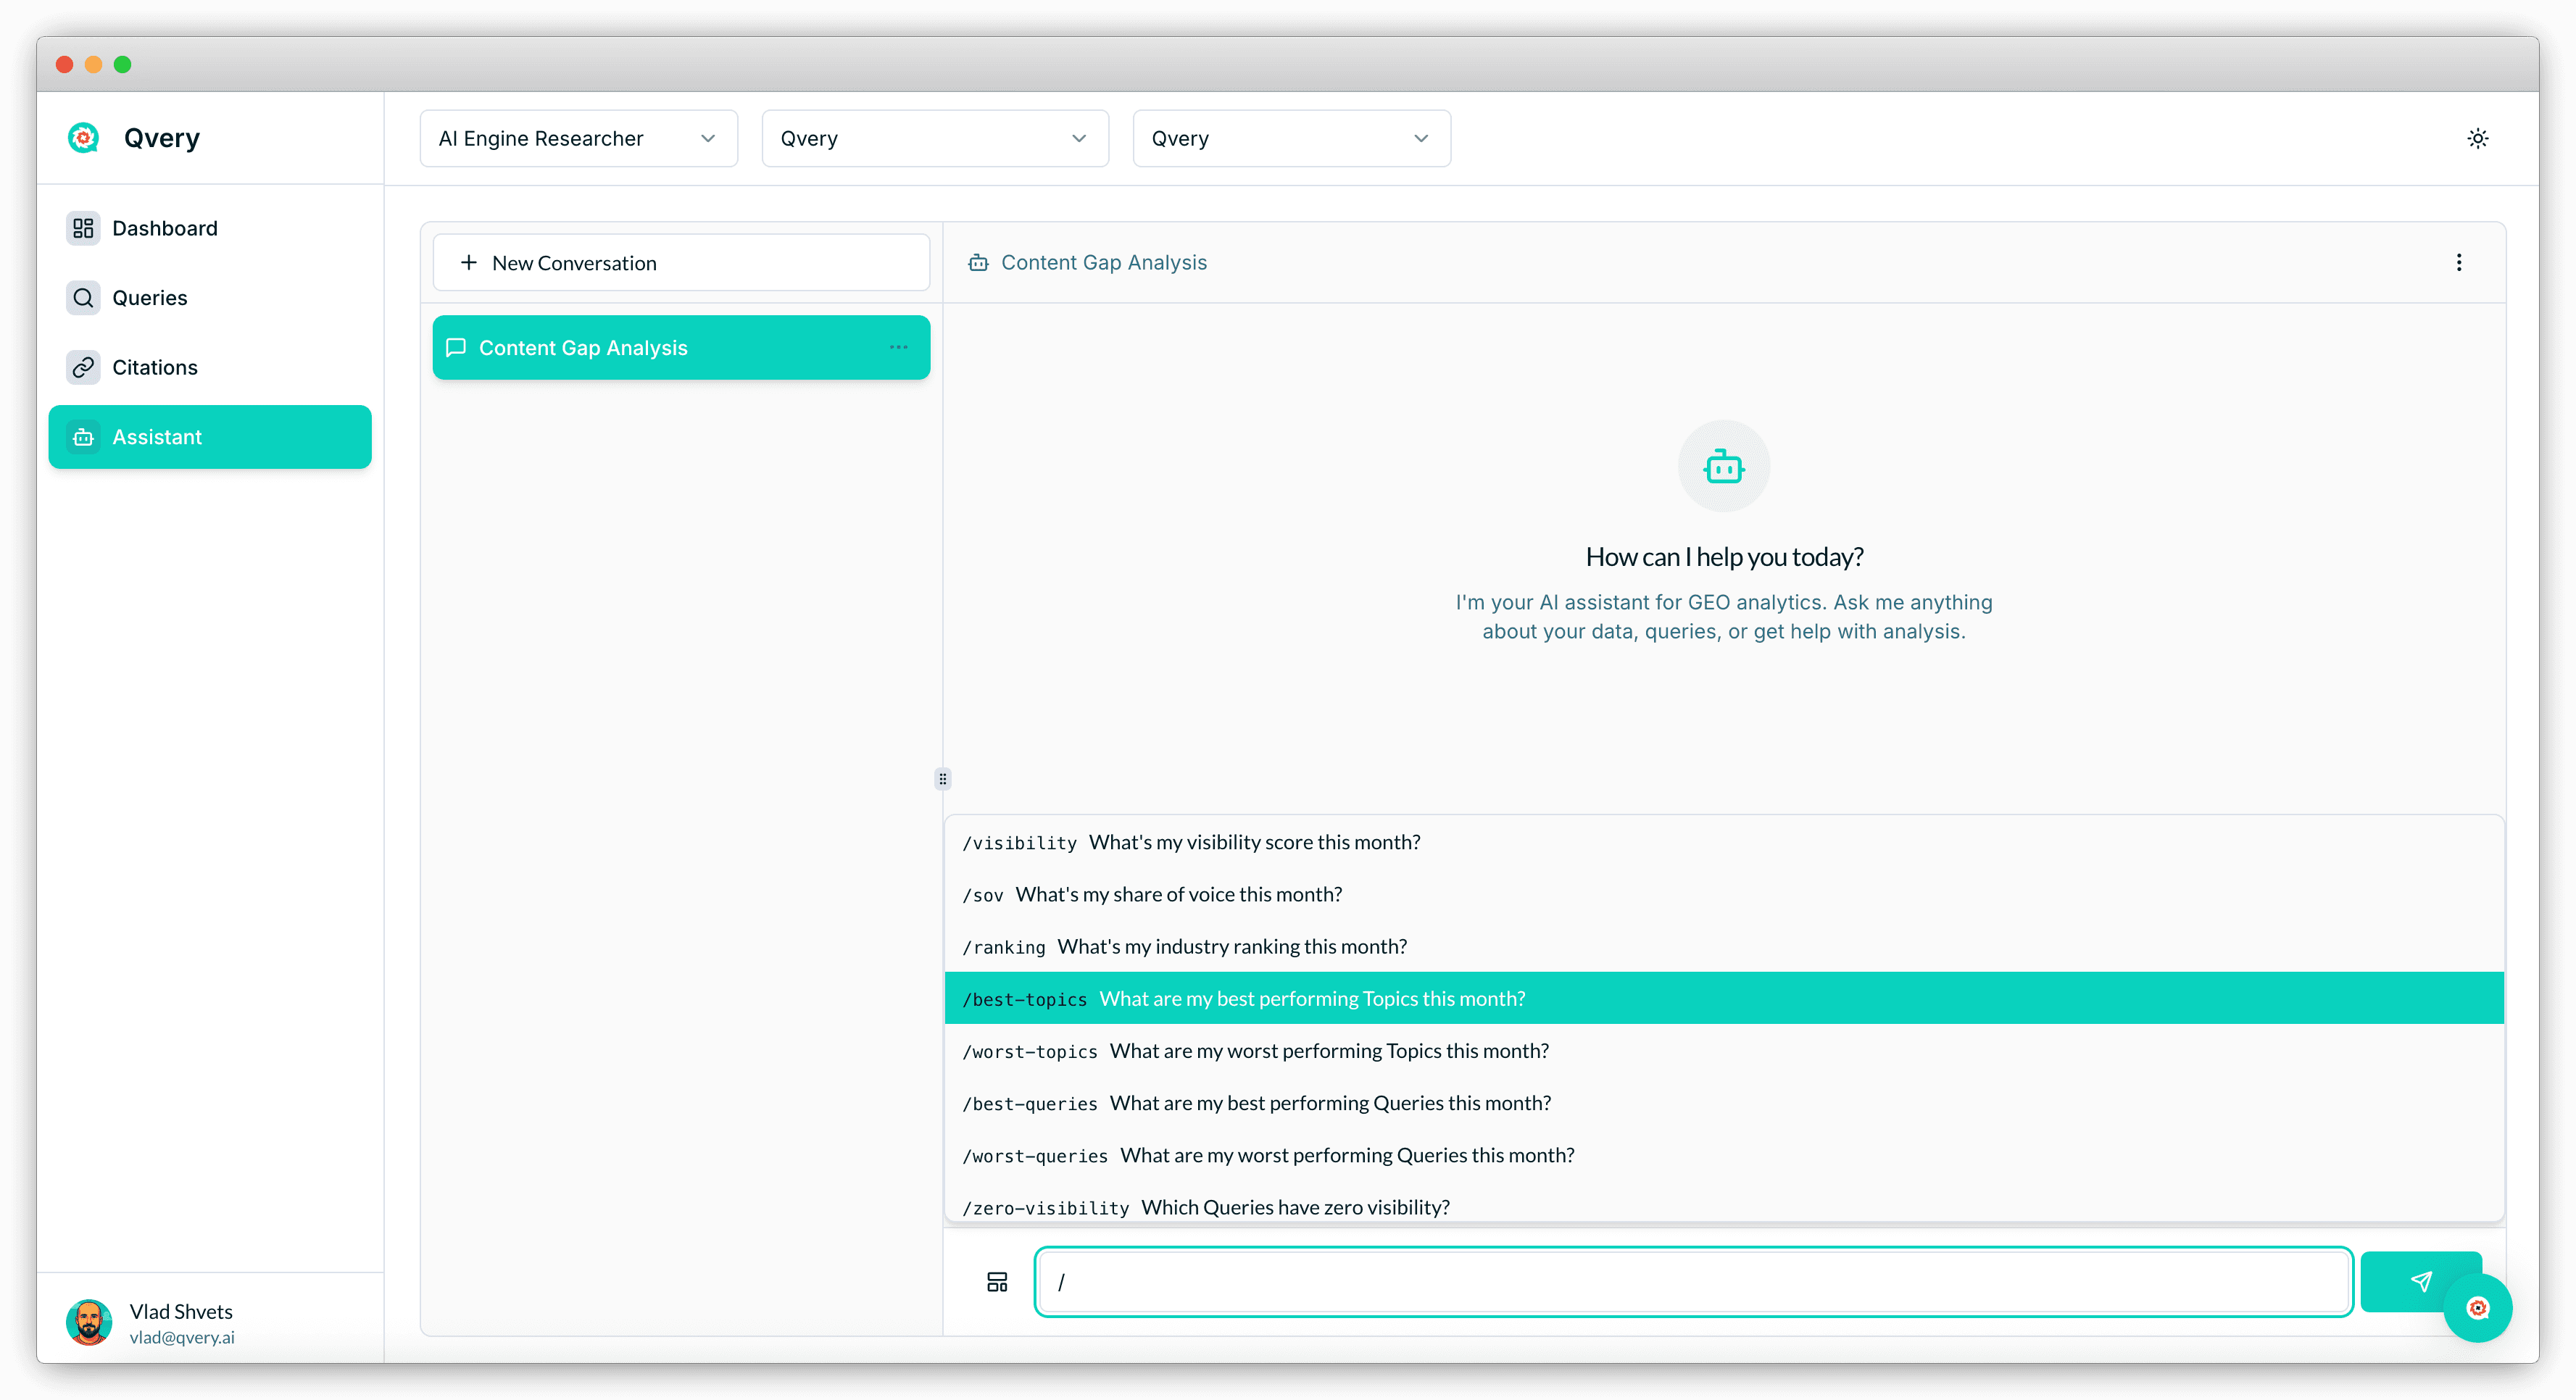
Two things Qvery will not do. It will not decide how many repeats your category needs, or hand you a stability score for a query. It runs the questions, keeps the citations, and lets you ask what they say.
And it will not stop you reading a single day's answer as a result. Nothing in the product prevents the mistake this whole article is about. That is what the four labels are for, next to any figure you circulate.
Start your free trial and let one month of repeats accumulate before you report anything.
Either way, pick your ten highest-value shopping questions and ask each of them on both engines several times this week, not once. Then write the four labels next to whatever number comes out.
That will be the first visibility figure you own that survives somebody asking how it was built.
We asked ChatGPT the same shopping question over and over inside a single collection window, changing nothing between runs, then compared which domains it cited each time.
Across pairs of runs of an identical query, the cited-domain sets overlapped at 0.3329. Two thirds of the sources moved.
No query in the set held its source list steady across repeats.
So if your read on whether ChatGPT recommends you comes from typing your money question into the box once and looking at what came back, you have a sample.
One run captures roughly a third of what one query can return.
What this records is which domains were cited. It does not establish why any one of them was chosen, and nothing in the design tested that.
Those figures come from a targeted set of ecommerce shopping queries we ran on ChatGPT and Google AI Mode, August 2026. Read them as direction, not as a census.
What follows is what to do instead, and the second number that keeps share of voice worth tracking.
The Same Question Returns A Different Source List Every Time
The measurement is a repeat test. Take one query, ask it repeatedly on ChatGPT inside one window, then compare the set of domains cited in each run against the set cited in every other run of the same query. Overlap is measured over those sets.
The denominator is run pairs, not runs, and that distinction carries through every figure here. Every two runs of a query form one pair, and the average is taken across all of them.
Averaged that way, the overlap is 0.3329. Two runs of an identical question agree on about a third of the sources they cite and disagree on the rest.
Nothing about the question changed between those runs. Same wording, same engine, same window, same country held constant throughout. Whatever moves sits in the retrieval step.
The mechanism is worth saying plainly, because it is less dramatic than it sounds. On a shopping question ChatGPT runs a live search, reads a handful of the pages that come back, and writes the answer from those. This is the same retrieval step that decides which products reach a shopping answer at all.
Which handful it reads is settled per run. Each run works from a slightly different stack of pages, and that stack is the variable.
A single answer, then, is one draw.
When your brand is missing from it, the absence is real for that run and says very little on its own. When your brand is present, the same caution applies in the other direction.
This is a ChatGPT figure. The Google AI Mode leg of the same collection did not produce enough repeats for a comparable stability number, so nothing here claims the two engines behave alike on this.
There Is No Calmer Question To Track
Every query we tested disagreed with itself at least once, and none returned a stable set of cited sources across its repeats. Instability here is the general case, not a property of a few volatile questions.
We split the set into two families before collecting anything. One holds category-discovery questions, from bare ones like "best air fryers" to constrained ones like "which power banks hold a charge long enough for a weekend backpacking trip without power outlets."
The other holds brand-evaluation questions, such as "is a merino base layer worth it for winter commuting" or "which electric kettle pours accurately for pour-over coffee."
The two families landed at 0.3561 and 0.3096. That gap is too small to build anything on, which is itself worth knowing: the instability is a property of the measurement, and it turns up whatever you ask.
You cannot pick your way around this. Every shape of question we tried moved by about the same amount, so a set built to look stable will not be.
The wobble is the same size for your competitors, so it favours nobody. It only punishes whoever measures once.
The rule that follows is dull and worth following anyway. When your brand vanishes from an answer it appeared in last week, re-ask before you open a content ticket. A single disappearance is no evidence that anything about your content changed.
The Noise Is Real, And The Signal Is Bigger
The second number is the one that rescues the metric. We ran the same overlap comparison between different queries inside the same family, on a different denominator: query pairs rather than run pairs. That figure is 0.0198.
Read the two carefully, because they do not share a denominator. Repeated runs of one question overlap at 0.3329 across run pairs. Two different questions overlap at 0.0198 across query pairs.
The distance between them is what makes tracking possible at all. If one question asked twice looked about as different as two unrelated questions, a share-of-voice figure would be mostly noise and there would be nothing to trend.
The data says otherwise, and not by a small margin.
A share of voice figure and a spot check are not the same measurement at different sample sizes. One is a rate; the other is an anecdote with a percent sign.
There is a reading of all this to avoid, which is that the engines are random and therefore not worth working on. The between-query figure says the opposite.
If retrieval were noise all the way down, two unrelated questions would look about as different from each other as one question does from itself. They are nowhere near that.
What you publish, and which questions it answers, moves the number far more than the wobble. The wobble is a reason to measure more carefully, not a reason to measure less.
What moved, run to run, is a read off the citation list, which is where the churn is visible at all.
The account in that view is not an ecommerce brand, and the ranked-weight read is the part that transfers.
Both halves of this matter. The instability kills the spot check. The distance between the two figures says share of voice is worth measuring, as long as the number you report is built from repeats, not from one look.
That is also the defensible version of a claim vendors in this space make constantly, ourselves included. Repetition is the step that turns a reading into a number, and this probe gives it a size.
Build The Set From What Shoppers Type, Then Repeat It
The query set is the part most teams get wrong first, so start there. Shoppers do not type your category page's title. They type the constraint that is bothering them.
Compare "best wireless earbuds" with "what blender should I get for making smoothies every morning for a family of four under $150." Both are real questions from this probe.
The second carries a budget, a use case, a frequency, and a household size. That is the shape most buying questions arrive in, and a set made only of bare category phrases will never see it.
So the set has five properties, and only the last one is optional:
Both families: bare category questions tell you whether you exist in the broad answer, constrained ones whether you survive contact with a real requirement.
Both engines: your buyers use both, so a set you only ask on one describes half the picture.
Everything else held still: we held country constant on purpose, because country is a confound when the thing being measured is variance.
Repeats, always: a query asked once has given you one draw, and the reading you want is the average across several.
Frozen strings: rewrite the wording and you have started a new series.
A tracked query is that exact string with its own run history, which is what makes an average possible at all.
How many repeats is a judgment call. Start with a schedule you will keep, and add repeats on the questions closest to your revenue. Spreading them evenly across a long list buys less.
Then aggregate across runs. Never compute the share inside a single one.
For each query, count the share of its runs where you appear, and report that share with the number of runs behind it. Do the same for each competitor and you have a share of voice built the way this data says it has to be built.
Resist reporting the most recent answer. It is one draw, and on its own it is the least informative row in the file.
One thing worth watching, flagged as judgment because the probe does not measure it: the queries where you show up in some runs and not others are the ones sitting on a threshold.
A query you never appear in and a query you appear in half the time are different problems. The second is closer to won than it looks.
That threshold group is the cheapest list you will build this quarter, and it only exists if you kept the runs.
Say What Your Number Is Made Of
A visibility figure without its construction does not travel, and most disagreements about one turn out to be disagreements about two numbers that were built differently. Four labels fix that:
Which engine produced it, since the two were not measured the same way here.
What window it covers.
Which denominator it uses: all runs, or only the answers that cited any source.
How many repeats sit behind it.
The last one is the label nobody writes down, and it decides whether two reports can be compared at all.
The same visibility figure from a single check and from a fortnight of repeats are not the same claim. Only one of them survives being asked how it was built.
The comparison case is worse than the single-brand case, and it is the one most reports are built on.
If your figure is one draw and your competitor's figure is one draw, the gap between them carries both wobbles at once. A small lead assembled that way will not survive being re-run.
Two brands measured across the same repeats, on the same queries, in the same window, is a comparison. Two brands each glanced at once is two guesses placed next to each other.
Cadence changes for the same reason. A weekly report built from daily runs is an average, and it steadies as the weeks accumulate. A weekly report built from one check every Monday is a string of single draws, and it will look volatile forever no matter how good your content gets.
The definitions are a separate question from the construction. If you want what visibility, share of voice, and average rank each measure, we wrote that up already.
Build The Repeats Into The Report In Qvery
Everything above can be done by hand. It is also the kind of work that stops happening by week three, which is roughly why Qvery exists in the shape it does.
Put your ten highest-value shopping questions in as tracked queries and leave them alone. Qvery asks them daily on ChatGPT and Google AI Mode and keeps every citation, tied to the query and the engine that produced it, so the repetition happens by default.
Then read it the way this article says a number has to be built:
Share of voice per topic: not per answer, so the figure is already an average across runs rather than a reading off the latest one.
The period filter: a longer window is more repeats, which is the same thing as a steadier number.
The engine filter: since the two engines were not measured the same way here, and a blended figure hides which one moved.
Per-query visibility: the queries you appear in on some runs and not others, which is the threshold list worth working on.
In Qvery Assistant you can ask for the same cut in plain language, including which of your tracked queries you never appear in at all.
Two things Qvery will not do. It will not decide how many repeats your category needs, or hand you a stability score for a query. It runs the questions, keeps the citations, and lets you ask what they say.
And it will not stop you reading a single day's answer as a result. Nothing in the product prevents the mistake this whole article is about. That is what the four labels are for, next to any figure you circulate.
Start your free trial and let one month of repeats accumulate before you report anything.
Either way, pick your ten highest-value shopping questions and ask each of them on both engines several times this week, not once. Then write the four labels next to whatever number comes out.
That will be the first visibility figure you own that survives somebody asking how it was built.
We asked ChatGPT the same shopping question over and over inside a single collection window, changing nothing between runs, then compared which domains it cited each time.
Across pairs of runs of an identical query, the cited-domain sets overlapped at 0.3329. Two thirds of the sources moved.
No query in the set held its source list steady across repeats.
So if your read on whether ChatGPT recommends you comes from typing your money question into the box once and looking at what came back, you have a sample.
One run captures roughly a third of what one query can return.
What this records is which domains were cited. It does not establish why any one of them was chosen, and nothing in the design tested that.
Those figures come from a targeted set of ecommerce shopping queries we ran on ChatGPT and Google AI Mode, August 2026. Read them as direction, not as a census.
What follows is what to do instead, and the second number that keeps share of voice worth tracking.
The Same Question Returns A Different Source List Every Time
The measurement is a repeat test. Take one query, ask it repeatedly on ChatGPT inside one window, then compare the set of domains cited in each run against the set cited in every other run of the same query. Overlap is measured over those sets.
The denominator is run pairs, not runs, and that distinction carries through every figure here. Every two runs of a query form one pair, and the average is taken across all of them.
Averaged that way, the overlap is 0.3329. Two runs of an identical question agree on about a third of the sources they cite and disagree on the rest.
Nothing about the question changed between those runs. Same wording, same engine, same window, same country held constant throughout. Whatever moves sits in the retrieval step.
The mechanism is worth saying plainly, because it is less dramatic than it sounds. On a shopping question ChatGPT runs a live search, reads a handful of the pages that come back, and writes the answer from those. This is the same retrieval step that decides which products reach a shopping answer at all.
Which handful it reads is settled per run. Each run works from a slightly different stack of pages, and that stack is the variable.
A single answer, then, is one draw.
When your brand is missing from it, the absence is real for that run and says very little on its own. When your brand is present, the same caution applies in the other direction.
This is a ChatGPT figure. The Google AI Mode leg of the same collection did not produce enough repeats for a comparable stability number, so nothing here claims the two engines behave alike on this.
There Is No Calmer Question To Track
Every query we tested disagreed with itself at least once, and none returned a stable set of cited sources across its repeats. Instability here is the general case, not a property of a few volatile questions.
We split the set into two families before collecting anything. One holds category-discovery questions, from bare ones like "best air fryers" to constrained ones like "which power banks hold a charge long enough for a weekend backpacking trip without power outlets."
The other holds brand-evaluation questions, such as "is a merino base layer worth it for winter commuting" or "which electric kettle pours accurately for pour-over coffee."
The two families landed at 0.3561 and 0.3096. That gap is too small to build anything on, which is itself worth knowing: the instability is a property of the measurement, and it turns up whatever you ask.
You cannot pick your way around this. Every shape of question we tried moved by about the same amount, so a set built to look stable will not be.
The wobble is the same size for your competitors, so it favours nobody. It only punishes whoever measures once.
The rule that follows is dull and worth following anyway. When your brand vanishes from an answer it appeared in last week, re-ask before you open a content ticket. A single disappearance is no evidence that anything about your content changed.
The Noise Is Real, And The Signal Is Bigger
The second number is the one that rescues the metric. We ran the same overlap comparison between different queries inside the same family, on a different denominator: query pairs rather than run pairs. That figure is 0.0198.
Read the two carefully, because they do not share a denominator. Repeated runs of one question overlap at 0.3329 across run pairs. Two different questions overlap at 0.0198 across query pairs.
The distance between them is what makes tracking possible at all. If one question asked twice looked about as different as two unrelated questions, a share-of-voice figure would be mostly noise and there would be nothing to trend.
The data says otherwise, and not by a small margin.
A share of voice figure and a spot check are not the same measurement at different sample sizes. One is a rate; the other is an anecdote with a percent sign.
There is a reading of all this to avoid, which is that the engines are random and therefore not worth working on. The between-query figure says the opposite.
If retrieval were noise all the way down, two unrelated questions would look about as different from each other as one question does from itself. They are nowhere near that.
What you publish, and which questions it answers, moves the number far more than the wobble. The wobble is a reason to measure more carefully, not a reason to measure less.
What moved, run to run, is a read off the citation list, which is where the churn is visible at all.
The account in that view is not an ecommerce brand, and the ranked-weight read is the part that transfers.
Both halves of this matter. The instability kills the spot check. The distance between the two figures says share of voice is worth measuring, as long as the number you report is built from repeats, not from one look.
That is also the defensible version of a claim vendors in this space make constantly, ourselves included. Repetition is the step that turns a reading into a number, and this probe gives it a size.
Build The Set From What Shoppers Type, Then Repeat It
The query set is the part most teams get wrong first, so start there. Shoppers do not type your category page's title. They type the constraint that is bothering them.
Compare "best wireless earbuds" with "what blender should I get for making smoothies every morning for a family of four under $150." Both are real questions from this probe.
The second carries a budget, a use case, a frequency, and a household size. That is the shape most buying questions arrive in, and a set made only of bare category phrases will never see it.
So the set has five properties, and only the last one is optional:
Both families: bare category questions tell you whether you exist in the broad answer, constrained ones whether you survive contact with a real requirement.
Both engines: your buyers use both, so a set you only ask on one describes half the picture.
Everything else held still: we held country constant on purpose, because country is a confound when the thing being measured is variance.
Repeats, always: a query asked once has given you one draw, and the reading you want is the average across several.
Frozen strings: rewrite the wording and you have started a new series.
A tracked query is that exact string with its own run history, which is what makes an average possible at all.
How many repeats is a judgment call. Start with a schedule you will keep, and add repeats on the questions closest to your revenue. Spreading them evenly across a long list buys less.
Then aggregate across runs. Never compute the share inside a single one.
For each query, count the share of its runs where you appear, and report that share with the number of runs behind it. Do the same for each competitor and you have a share of voice built the way this data says it has to be built.
Resist reporting the most recent answer. It is one draw, and on its own it is the least informative row in the file.
One thing worth watching, flagged as judgment because the probe does not measure it: the queries where you show up in some runs and not others are the ones sitting on a threshold.
A query you never appear in and a query you appear in half the time are different problems. The second is closer to won than it looks.
That threshold group is the cheapest list you will build this quarter, and it only exists if you kept the runs.
Say What Your Number Is Made Of
A visibility figure without its construction does not travel, and most disagreements about one turn out to be disagreements about two numbers that were built differently. Four labels fix that:
Which engine produced it, since the two were not measured the same way here.
What window it covers.
Which denominator it uses: all runs, or only the answers that cited any source.
How many repeats sit behind it.
The last one is the label nobody writes down, and it decides whether two reports can be compared at all.
The same visibility figure from a single check and from a fortnight of repeats are not the same claim. Only one of them survives being asked how it was built.
The comparison case is worse than the single-brand case, and it is the one most reports are built on.
If your figure is one draw and your competitor's figure is one draw, the gap between them carries both wobbles at once. A small lead assembled that way will not survive being re-run.
Two brands measured across the same repeats, on the same queries, in the same window, is a comparison. Two brands each glanced at once is two guesses placed next to each other.
Cadence changes for the same reason. A weekly report built from daily runs is an average, and it steadies as the weeks accumulate. A weekly report built from one check every Monday is a string of single draws, and it will look volatile forever no matter how good your content gets.
The definitions are a separate question from the construction. If you want what visibility, share of voice, and average rank each measure, we wrote that up already.
Build The Repeats Into The Report In Qvery
Everything above can be done by hand. It is also the kind of work that stops happening by week three, which is roughly why Qvery exists in the shape it does.
Put your ten highest-value shopping questions in as tracked queries and leave them alone. Qvery asks them daily on ChatGPT and Google AI Mode and keeps every citation, tied to the query and the engine that produced it, so the repetition happens by default.
Then read it the way this article says a number has to be built:
Share of voice per topic: not per answer, so the figure is already an average across runs rather than a reading off the latest one.
The period filter: a longer window is more repeats, which is the same thing as a steadier number.
The engine filter: since the two engines were not measured the same way here, and a blended figure hides which one moved.
Per-query visibility: the queries you appear in on some runs and not others, which is the threshold list worth working on.
In Qvery Assistant you can ask for the same cut in plain language, including which of your tracked queries you never appear in at all.
Two things Qvery will not do. It will not decide how many repeats your category needs, or hand you a stability score for a query. It runs the questions, keeps the citations, and lets you ask what they say.
And it will not stop you reading a single day's answer as a result. Nothing in the product prevents the mistake this whole article is about. That is what the four labels are for, next to any figure you circulate.
Start your free trial and let one month of repeats accumulate before you report anything.
Either way, pick your ten highest-value shopping questions and ask each of them on both engines several times this week, not once. Then write the four labels next to whatever number comes out.
That will be the first visibility figure you own that survives somebody asking how it was built.
We asked ChatGPT the same shopping question over and over inside a single collection window, changing nothing between runs, then compared which domains it cited each time.
Across pairs of runs of an identical query, the cited-domain sets overlapped at 0.3329. Two thirds of the sources moved.
No query in the set held its source list steady across repeats.
So if your read on whether ChatGPT recommends you comes from typing your money question into the box once and looking at what came back, you have a sample.
One run captures roughly a third of what one query can return.
What this records is which domains were cited. It does not establish why any one of them was chosen, and nothing in the design tested that.
Those figures come from a targeted set of ecommerce shopping queries we ran on ChatGPT and Google AI Mode, August 2026. Read them as direction, not as a census.
What follows is what to do instead, and the second number that keeps share of voice worth tracking.
The Same Question Returns A Different Source List Every Time
The measurement is a repeat test. Take one query, ask it repeatedly on ChatGPT inside one window, then compare the set of domains cited in each run against the set cited in every other run of the same query. Overlap is measured over those sets.
The denominator is run pairs, not runs, and that distinction carries through every figure here. Every two runs of a query form one pair, and the average is taken across all of them.
Averaged that way, the overlap is 0.3329. Two runs of an identical question agree on about a third of the sources they cite and disagree on the rest.
Nothing about the question changed between those runs. Same wording, same engine, same window, same country held constant throughout. Whatever moves sits in the retrieval step.
The mechanism is worth saying plainly, because it is less dramatic than it sounds. On a shopping question ChatGPT runs a live search, reads a handful of the pages that come back, and writes the answer from those. This is the same retrieval step that decides which products reach a shopping answer at all.
Which handful it reads is settled per run. Each run works from a slightly different stack of pages, and that stack is the variable.
A single answer, then, is one draw.
When your brand is missing from it, the absence is real for that run and says very little on its own. When your brand is present, the same caution applies in the other direction.
This is a ChatGPT figure. The Google AI Mode leg of the same collection did not produce enough repeats for a comparable stability number, so nothing here claims the two engines behave alike on this.
There Is No Calmer Question To Track
Every query we tested disagreed with itself at least once, and none returned a stable set of cited sources across its repeats. Instability here is the general case, not a property of a few volatile questions.
We split the set into two families before collecting anything. One holds category-discovery questions, from bare ones like "best air fryers" to constrained ones like "which power banks hold a charge long enough for a weekend backpacking trip without power outlets."
The other holds brand-evaluation questions, such as "is a merino base layer worth it for winter commuting" or "which electric kettle pours accurately for pour-over coffee."
The two families landed at 0.3561 and 0.3096. That gap is too small to build anything on, which is itself worth knowing: the instability is a property of the measurement, and it turns up whatever you ask.
You cannot pick your way around this. Every shape of question we tried moved by about the same amount, so a set built to look stable will not be.
The wobble is the same size for your competitors, so it favours nobody. It only punishes whoever measures once.
The rule that follows is dull and worth following anyway. When your brand vanishes from an answer it appeared in last week, re-ask before you open a content ticket. A single disappearance is no evidence that anything about your content changed.
The Noise Is Real, And The Signal Is Bigger
The second number is the one that rescues the metric. We ran the same overlap comparison between different queries inside the same family, on a different denominator: query pairs rather than run pairs. That figure is 0.0198.
Read the two carefully, because they do not share a denominator. Repeated runs of one question overlap at 0.3329 across run pairs. Two different questions overlap at 0.0198 across query pairs.
The distance between them is what makes tracking possible at all. If one question asked twice looked about as different as two unrelated questions, a share-of-voice figure would be mostly noise and there would be nothing to trend.
The data says otherwise, and not by a small margin.
A share of voice figure and a spot check are not the same measurement at different sample sizes. One is a rate; the other is an anecdote with a percent sign.
There is a reading of all this to avoid, which is that the engines are random and therefore not worth working on. The between-query figure says the opposite.
If retrieval were noise all the way down, two unrelated questions would look about as different from each other as one question does from itself. They are nowhere near that.
What you publish, and which questions it answers, moves the number far more than the wobble. The wobble is a reason to measure more carefully, not a reason to measure less.
What moved, run to run, is a read off the citation list, which is where the churn is visible at all.
The account in that view is not an ecommerce brand, and the ranked-weight read is the part that transfers.
Both halves of this matter. The instability kills the spot check. The distance between the two figures says share of voice is worth measuring, as long as the number you report is built from repeats, not from one look.
That is also the defensible version of a claim vendors in this space make constantly, ourselves included. Repetition is the step that turns a reading into a number, and this probe gives it a size.
Build The Set From What Shoppers Type, Then Repeat It
The query set is the part most teams get wrong first, so start there. Shoppers do not type your category page's title. They type the constraint that is bothering them.
Compare "best wireless earbuds" with "what blender should I get for making smoothies every morning for a family of four under $150." Both are real questions from this probe.
The second carries a budget, a use case, a frequency, and a household size. That is the shape most buying questions arrive in, and a set made only of bare category phrases will never see it.
So the set has five properties, and only the last one is optional:
Both families: bare category questions tell you whether you exist in the broad answer, constrained ones whether you survive contact with a real requirement.
Both engines: your buyers use both, so a set you only ask on one describes half the picture.
Everything else held still: we held country constant on purpose, because country is a confound when the thing being measured is variance.
Repeats, always: a query asked once has given you one draw, and the reading you want is the average across several.
Frozen strings: rewrite the wording and you have started a new series.
A tracked query is that exact string with its own run history, which is what makes an average possible at all.
How many repeats is a judgment call. Start with a schedule you will keep, and add repeats on the questions closest to your revenue. Spreading them evenly across a long list buys less.
Then aggregate across runs. Never compute the share inside a single one.
For each query, count the share of its runs where you appear, and report that share with the number of runs behind it. Do the same for each competitor and you have a share of voice built the way this data says it has to be built.
Resist reporting the most recent answer. It is one draw, and on its own it is the least informative row in the file.
One thing worth watching, flagged as judgment because the probe does not measure it: the queries where you show up in some runs and not others are the ones sitting on a threshold.
A query you never appear in and a query you appear in half the time are different problems. The second is closer to won than it looks.
That threshold group is the cheapest list you will build this quarter, and it only exists if you kept the runs.
Say What Your Number Is Made Of
A visibility figure without its construction does not travel, and most disagreements about one turn out to be disagreements about two numbers that were built differently. Four labels fix that:
Which engine produced it, since the two were not measured the same way here.
What window it covers.
Which denominator it uses: all runs, or only the answers that cited any source.
How many repeats sit behind it.
The last one is the label nobody writes down, and it decides whether two reports can be compared at all.
The same visibility figure from a single check and from a fortnight of repeats are not the same claim. Only one of them survives being asked how it was built.
The comparison case is worse than the single-brand case, and it is the one most reports are built on.
If your figure is one draw and your competitor's figure is one draw, the gap between them carries both wobbles at once. A small lead assembled that way will not survive being re-run.
Two brands measured across the same repeats, on the same queries, in the same window, is a comparison. Two brands each glanced at once is two guesses placed next to each other.
Cadence changes for the same reason. A weekly report built from daily runs is an average, and it steadies as the weeks accumulate. A weekly report built from one check every Monday is a string of single draws, and it will look volatile forever no matter how good your content gets.
The definitions are a separate question from the construction. If you want what visibility, share of voice, and average rank each measure, we wrote that up already.
Build The Repeats Into The Report In Qvery
Everything above can be done by hand. It is also the kind of work that stops happening by week three, which is roughly why Qvery exists in the shape it does.
Put your ten highest-value shopping questions in as tracked queries and leave them alone. Qvery asks them daily on ChatGPT and Google AI Mode and keeps every citation, tied to the query and the engine that produced it, so the repetition happens by default.
Then read it the way this article says a number has to be built:
Share of voice per topic: not per answer, so the figure is already an average across runs rather than a reading off the latest one.
The period filter: a longer window is more repeats, which is the same thing as a steadier number.
The engine filter: since the two engines were not measured the same way here, and a blended figure hides which one moved.
Per-query visibility: the queries you appear in on some runs and not others, which is the threshold list worth working on.
In Qvery Assistant you can ask for the same cut in plain language, including which of your tracked queries you never appear in at all.
Two things Qvery will not do. It will not decide how many repeats your category needs, or hand you a stability score for a query. It runs the questions, keeps the citations, and lets you ask what they say.
And it will not stop you reading a single day's answer as a result. Nothing in the product prevents the mistake this whole article is about. That is what the four labels are for, next to any figure you circulate.
Start your free trial and let one month of repeats accumulate before you report anything.
Either way, pick your ten highest-value shopping questions and ask each of them on both engines several times this week, not once. Then write the four labels next to whatever number comes out.
That will be the first visibility figure you own that survives somebody asking how it was built.

© 2026 Qvery AI OÜ