By
Vlad Shvets
AI Engine Optimization Guide For Fintech Companies
Every fintech marketer has heard the same advice about AI search: get into the roundups. Get on NerdWallet's best-of list, get into Forbes Advisor, get on...
Every fintech marketer has heard the same advice about AI search: get into the roundups. Get on NerdWallet's best-of list, get into Forbes Advisor, get on...
Every fintech marketer has heard the same advice about AI search: get into the roundups. Get on NerdWallet's best-of list, get into Forbes Advisor, get on...
Every fintech marketer has heard the same advice about AI search: get into the roundups. Get on NerdWallet's best-of list, get into Forbes Advisor, get on Bankrate.
It is a widely held belief and it has not been tested much. So we ran a targeted collection to see which sources co-occur with the answers, and where that belief stops describing what is in front of you.
The short version: the roundup layer is real, it is powerful in one tier and much weaker in another, and it is more spread out than its reputation suggests.
One boundary before any number. This measures which sources appear alongside AI answers. It does not measure whether getting placed on those sites causes an engine to name you, and nothing here was designed to show that.
The Layer Is A Consumer Phenomenon
We treated NerdWallet, Forbes, and Bankrate as a single unit and asked what share of answers cite at least one of them. Then we split that by whether the question came from a consumer or a business buyer.
This is a targeted 149-query recommendation probe collected in August 2026, weighted toward the US (US70/GB15/CA8/AU7). ChatGPT contributes three web-search runs per query and may not search on every run; Google AI Mode contributes one run. Results are a directional snapshot of cited answers, not a causal test of publisher inclusion or brand naming.
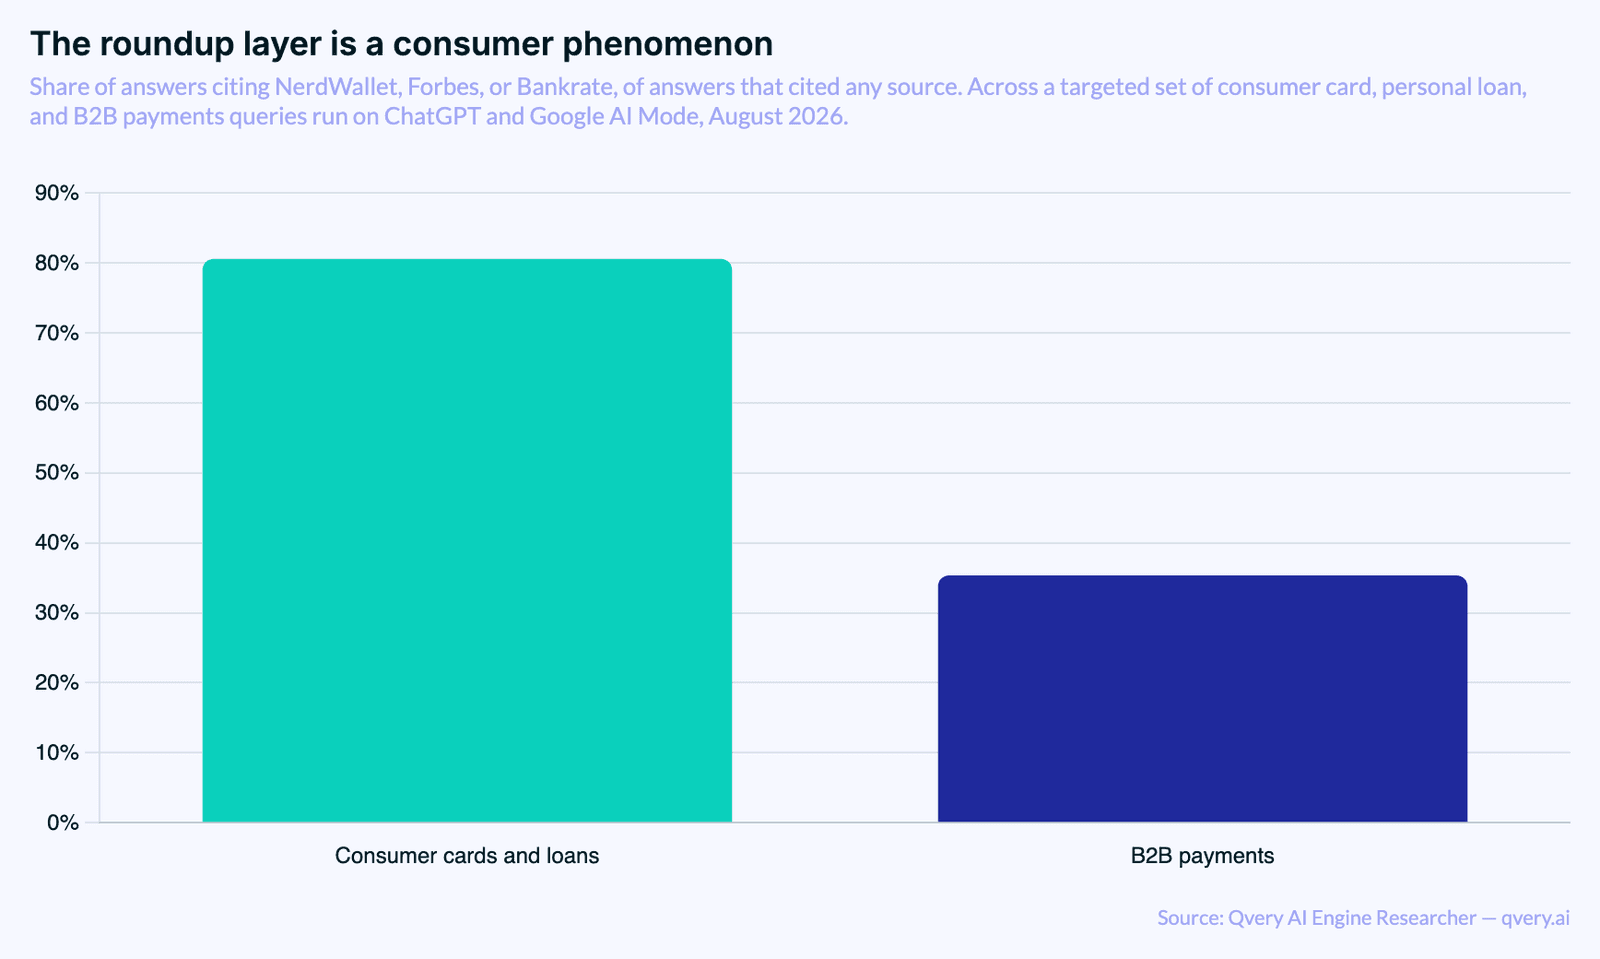
In consumer cards and personal loans, 80.61% of answers that cited any source cited at least one of those three. In B2B payments the same figure is 35.35%. Both arms cleared our reporting floor comfortably.
A 2.28 times gap between the two tiers. The trio appears in 80.61% of cited consumer answers against 35.35% of cited B2B ones, which is a different enough surface that one playbook covering both is describing only one of them.
What Occupies B2B Instead
The obvious next question is what appears in the rest of those B2B answers. The composition is more interesting than a thinner version of the same list.
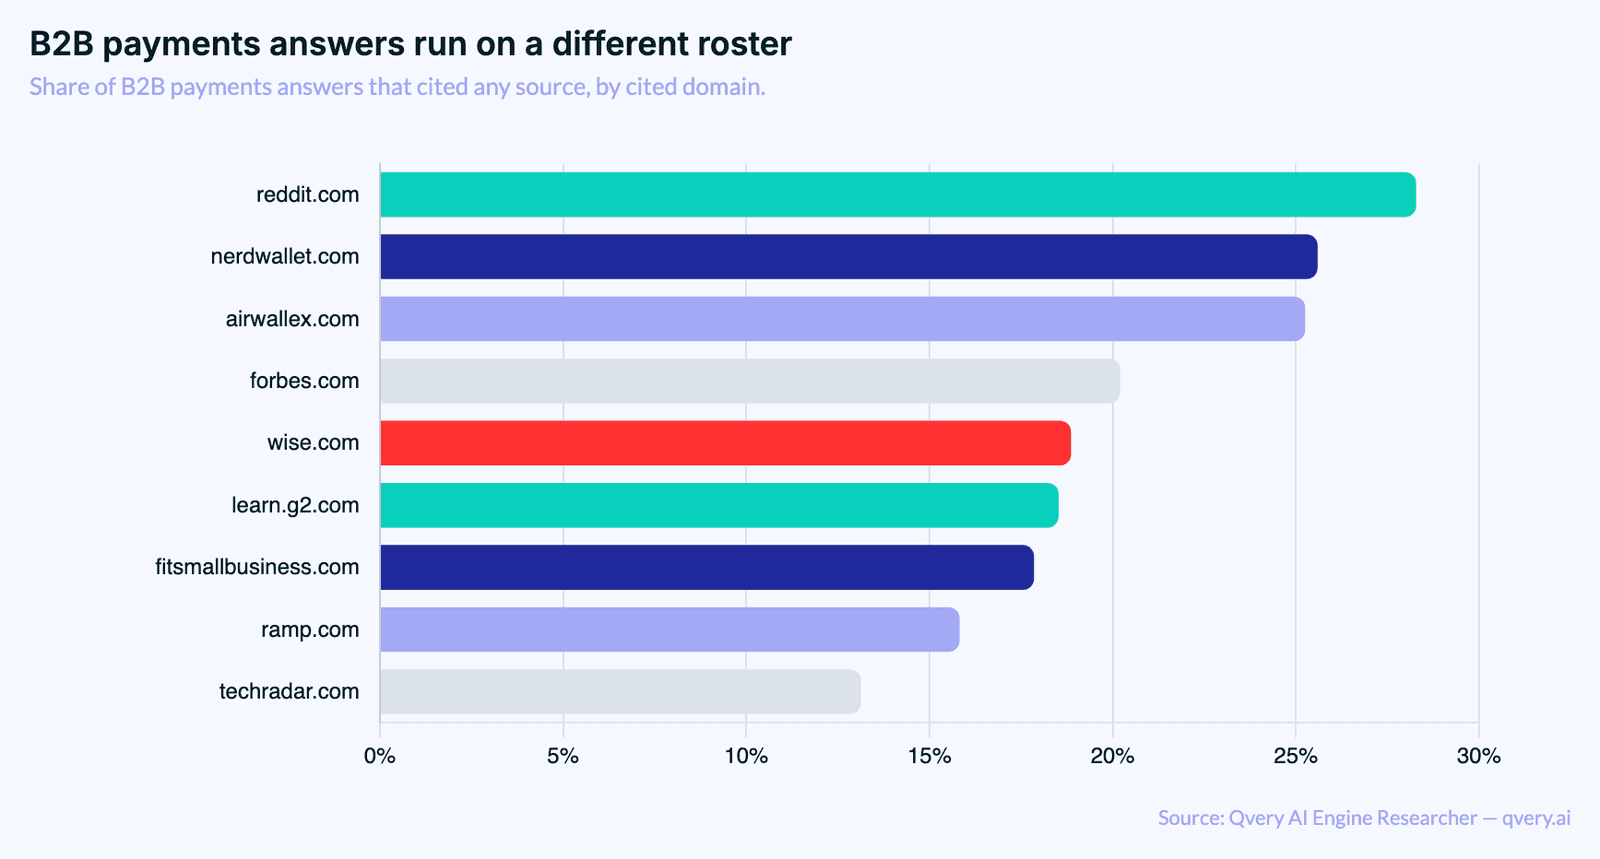
Reddit leads the B2B roster at 28.28% of cited answers, ahead of every editorial publisher in that arm.
Then the part worth reading twice. Sitting third at 25.25% is airwallex.com. Wise appears in 18.86%, Ramp in 15.82%.
Those are vendors, appearing on their own domains, inside answers about the category they compete in.
The consumer arm looks different. Its five leading sources are editorial finance names: Forbes at 60.54%, NerdWallet at 59.52%, the Wall Street Journal at 42.52%, Bankrate at 40.82%, and WalletHub at 28.91%. Reddit and YouTube appear in the consumer roster too, further down. What does not appear in that leading group is a card issuer's own site.
In consumer fintech, the sources leading the cited layer are ones you have to be written into. In B2B payments, competitors' own domains are already inside it.
That difference is the most useful thing in this collection. Vendor-owned domains are visibly present in the B2B surface, while no card issuer's own site appears in the consumer arm's leading group. For how trust signals behave more broadly in this vertical, see our fintech trust signals breakdown.
It also changes what a competitive audit looks like. In the consumer arm, the sources you would track are third-party publishers. In the B2B arm, a competitor's own pricing or comparison page is itself a cited source, and it is one they control completely.
Software directories sit in that same B2B group. G2's learn subdomain appears in 18.52% of cited B2B answers and fitsmallbusiness.com in 17.85%, both ahead of Ramp and TechRadar. Those are listing surfaces with their own inclusion processes, separate from editorial pitching.
Turning URL Recurrence Into An Audit List
Domain-level shares tell you who appears. They do not tell you which individual pages keep coming back, which is a separate question this cut was designed to answer.
The trio's citations spread across a wide set of individual pages rather than concentrating. Its most recurrent pages together carry 9.35% of all trio-URL query appearances.
We pre-registered both possible outcomes: a concentrated short list of pages, or a flat portfolio. The measurement returned flat. That distinction was the point of the cut, and it is the extent of what the cut can settle.
The trio URLs that recur across the most distinct queries, in order:
Forbes Advisor's best cash-back credit cards page
Forbes Advisor's best credit cards page
NerdWallet's best corporate credit cards page for business
Forbes Advisor's best corporate credit cards page
NerdWallet's best credit cards page
Forbes Advisor's best payment gateways page for business software
Forbes Advisor's best online personal loans page
Every one is an evergreen category page rather than a news story, a product review, or a launch write-up. The pages that recur are the standing "best X" pages a publisher maintains. Three of the seven are business-vertical URLs, so the B2B roundup layer exists on the same publishers through separate pages. For more on how page type relates to citation, see our breakdown of the most-cited content types.
The pages that recur in these answers are standing category pages, not write-ups about any one company.
The Famous Three Are Not The Most Recurrent Pages
Widen past those three domains and the picture shifts again.
The most recurrent page in the entire collection is a Wall Street Journal buyside personal loans page. It recurs across 2.5 times as many distinct queries as the best-performing trio page, and three further WSJ pages also exceed it.
Investopedia's 2026 credit card awards page recurs at a comparable level, as do mypayadvisor.com's comparisons page and a layer3labs.io comparison page. Those last two are vendor-side comparison content, consistent with what the B2B roster showed.
Reading The Qualifier Test Conditionally
The collection also carried a pre-defined split by question depth, and it comes with tighter limits than the tier contrast.
One arm was short and generic, averaging 4.61 words: "best travel rewards credit cards." The other carried qualifiers, averaging 12.61 words: "best credit card for someone with a 640 score trying to rebuild after a rough year." The two arms were near-equal in size and defined before collection.
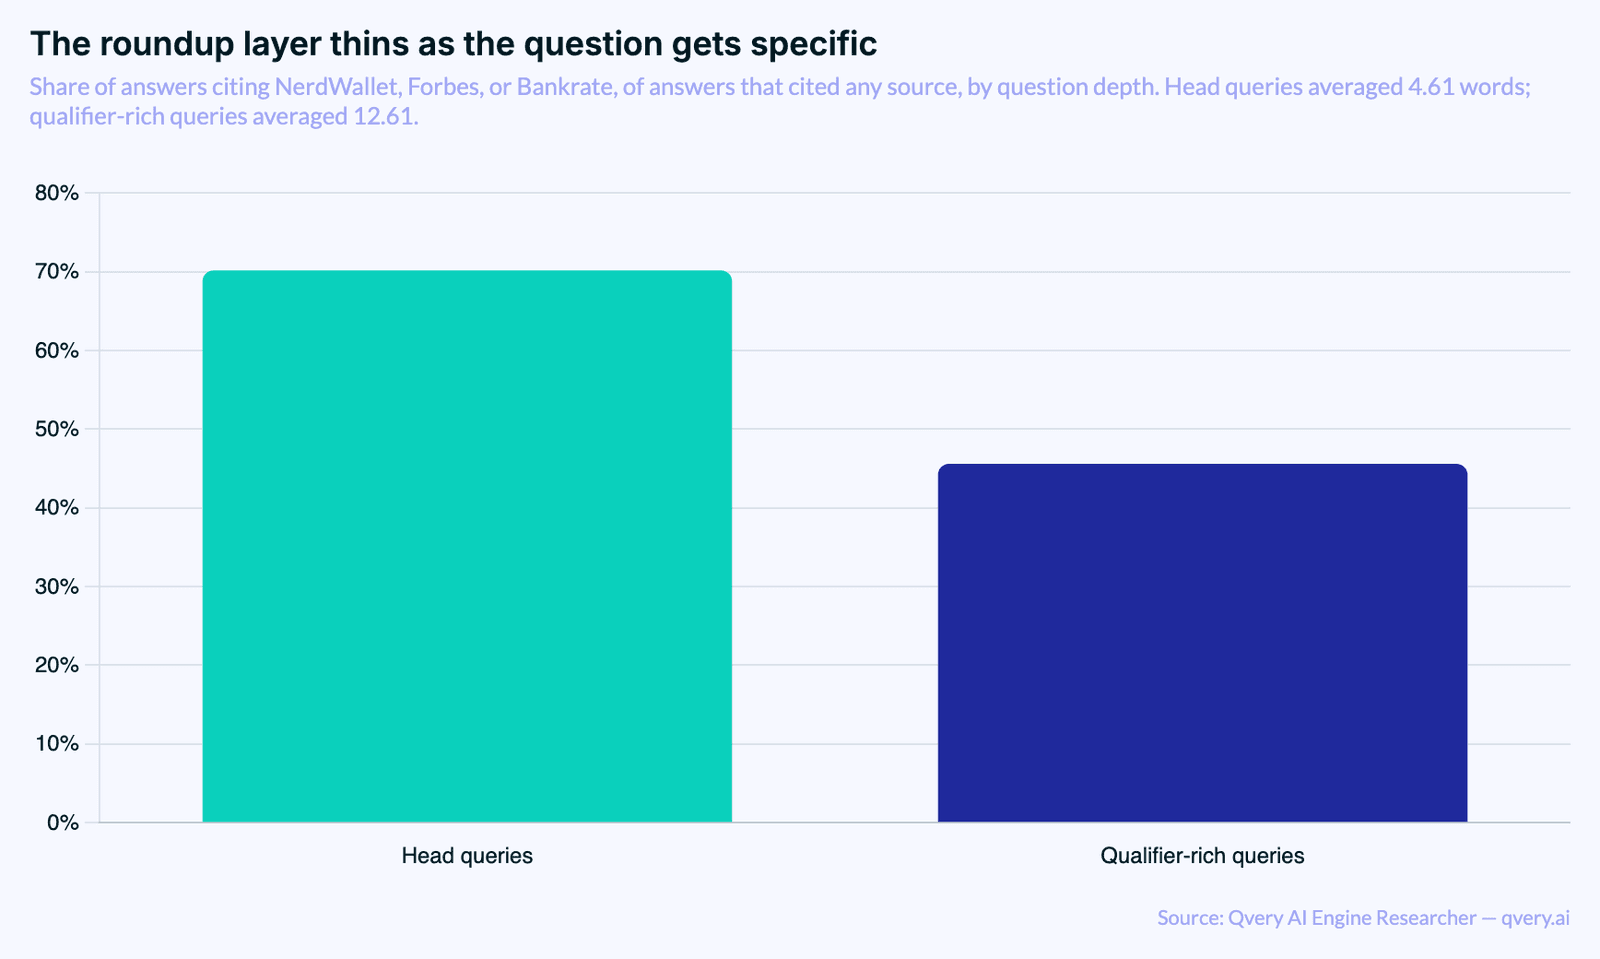
The trio appears in 70.17% of head-query cited answers and 45.61% of qualifier-rich ones, a difference of 24.56 percentage points between the two pre-defined arms.
That is an association observed in this sample between two arms we defined in advance. It is not a demonstrated process by which adding qualifiers changes which sources an engine selects, and this collection cannot separate those two readings.
Treat it as conditional evidence about where the trio's presence is strongest in one snapshot. Record your own query set the same way before drawing anything from it.
The practical consequence is about how you build a query set at all. If you only measure short category questions, you are sampling the part of the surface where the trio is strongest, and your audit will overstate how much of your category the roundup layer covers. A set weighted only toward qualifier-rich questions has the mirror problem.
Carry both arms, label them, and never average them into one figure.
Reading The Domain Shares Against A Prior
One more set of numbers, with a caveat that should travel with them everywhere.
Measured across all runs rather than only cited ones, and labeled as a separate denominator: NerdWallet appears in 42.11%, Forbes in 39.93%, the Wall Street Journal in 21.31%, Bankrate in 20.13%, and WalletHub in 15.77%.
Against our June fintech prior, the exact deltas are NerdWallet +19.57, Forbes +19.75, the Wall Street Journal +15.31, Bankrate +10.29, and WalletHub +14.10 percentage points.
Here is why that elevation is weaker evidence than it looks. This query set was built around roundup-shaped questions on purpose, so a comparison against a broad prior is partly measuring our own query design. Use it as context for why the layer deserves attention, never as evidence that the layer grew.
On engine behaviour: ChatGPT triggered a search on 98.88% of its runs here and Google AI Mode on 100% of its own. That is an August 2026 observation rather than a fixed property of either engine, and it is no basis for preferring one.
Keeping The Citation Record Current
All of the above describes one collection at one moment. The version that helps you runs against your own category on a schedule.
Four things decide whether that record is readable a quarter from now:
Split by tier and depth before measuring. Consumer versus business, short versus qualifier-rich. Every result here lives inside those two splits, and a pooled number would have hidden all of them.
Record the URL, not just the domain. "NerdWallet was cited" is not an audit line. The specific page, its type, and how many distinct queries it appears for is.
Watch your own domain in the B2B set. Vendor domains held real share in the B2B arm here, so your own pages are worth tracking as a cited source rather than only as a destination.
Keep denominators separate and labelled. Share of all answers and share of answers that cited something are different numbers, and a denominator change can look exactly like a gain.
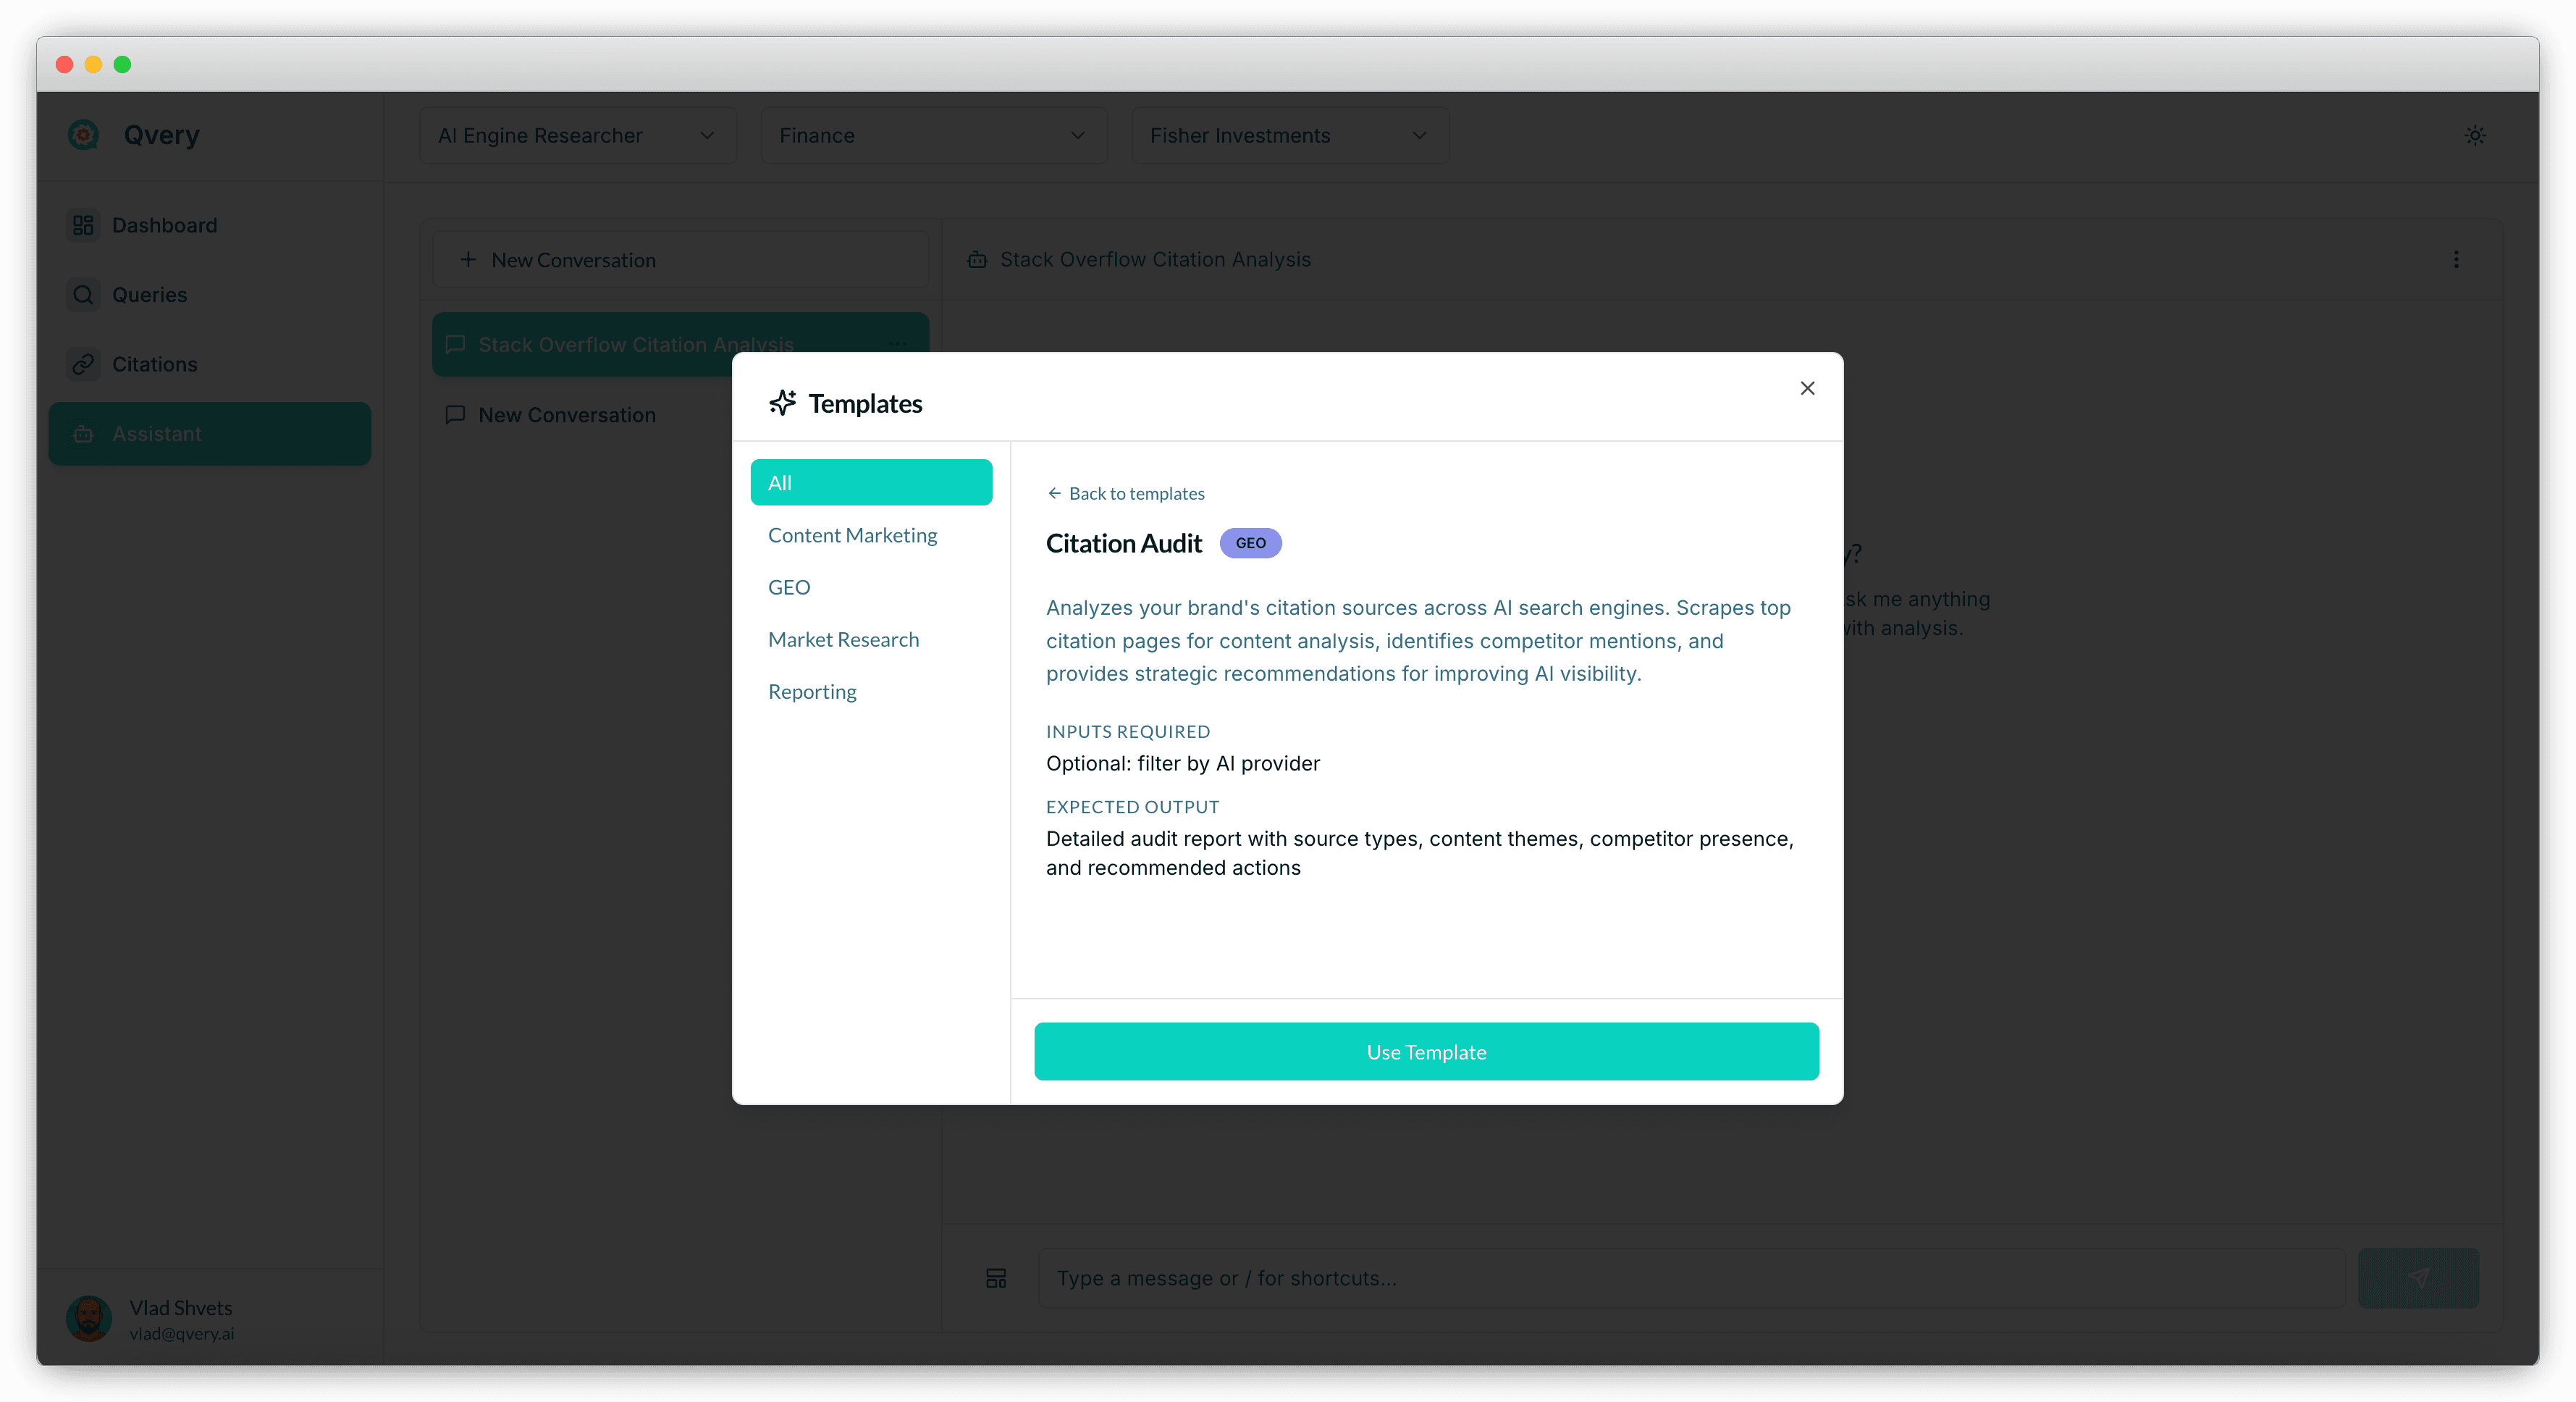
Qvery supplies the tracking layer underneath that. It tracks visibility, share of voice, and average rank across ChatGPT and Google AI Mode daily, in over 200 countries, and captures every citation tied to the query and engine that produced it. In Qvery Assistant you can ask about your own visibility, share of voice, citation, topic, and query data, add queries, trigger a run, or export a report.
The source, URL, page-type, and recurrence classification stays yours to maintain alongside those records, which after everything above is where that judgment belongs.
Start your free trial and split your first month of citations by tier and query depth.
Writer's Judgment, Not A Finding
Flagging this clearly, because the rest of the article stays inside what was measured.
Given that the recurring pages are standing category pages rather than articles, our judgment is that an inclusion request aimed at a maintained best-of page is the better ask. Recurrence does not show that such a pitch would succeed, or that inclusion would produce a naming.
Given that vendor domains are visibly present in the B2B surface and absent from the consumer leading group, our judgment is that a B2B fintech should treat its own content as part of the plan next to publisher outreach. That is a view about where effort is likely to be worth spending. Nothing here establishes it causally.
And where competitor answers repeatedly cite a source you have never audited, that absence is worth investigating. It does not show that appearing there will produce a naming.
What the collection did establish is narrower and more durable. The trio appears in 80.61% of cited consumer answers and 35.35% of cited B2B ones, its presence differs by 24.56 percentage points between head and qualifier-rich arms, and its citations spread across a wide set of individual pages rather than concentrating in a handful. Those bounds tell you where the standard advice stops describing your surface.
Every fintech marketer has heard the same advice about AI search: get into the roundups. Get on NerdWallet's best-of list, get into Forbes Advisor, get on Bankrate.
It is a widely held belief and it has not been tested much. So we ran a targeted collection to see which sources co-occur with the answers, and where that belief stops describing what is in front of you.
The short version: the roundup layer is real, it is powerful in one tier and much weaker in another, and it is more spread out than its reputation suggests.
One boundary before any number. This measures which sources appear alongside AI answers. It does not measure whether getting placed on those sites causes an engine to name you, and nothing here was designed to show that.
The Layer Is A Consumer Phenomenon
We treated NerdWallet, Forbes, and Bankrate as a single unit and asked what share of answers cite at least one of them. Then we split that by whether the question came from a consumer or a business buyer.
This is a targeted 149-query recommendation probe collected in August 2026, weighted toward the US (US70/GB15/CA8/AU7). ChatGPT contributes three web-search runs per query and may not search on every run; Google AI Mode contributes one run. Results are a directional snapshot of cited answers, not a causal test of publisher inclusion or brand naming.
In consumer cards and personal loans, 80.61% of answers that cited any source cited at least one of those three. In B2B payments the same figure is 35.35%. Both arms cleared our reporting floor comfortably.
A 2.28 times gap between the two tiers. The trio appears in 80.61% of cited consumer answers against 35.35% of cited B2B ones, which is a different enough surface that one playbook covering both is describing only one of them.
What Occupies B2B Instead
The obvious next question is what appears in the rest of those B2B answers. The composition is more interesting than a thinner version of the same list.
Reddit leads the B2B roster at 28.28% of cited answers, ahead of every editorial publisher in that arm.
Then the part worth reading twice. Sitting third at 25.25% is airwallex.com. Wise appears in 18.86%, Ramp in 15.82%.
Those are vendors, appearing on their own domains, inside answers about the category they compete in.
The consumer arm looks different. Its five leading sources are editorial finance names: Forbes at 60.54%, NerdWallet at 59.52%, the Wall Street Journal at 42.52%, Bankrate at 40.82%, and WalletHub at 28.91%. Reddit and YouTube appear in the consumer roster too, further down. What does not appear in that leading group is a card issuer's own site.
In consumer fintech, the sources leading the cited layer are ones you have to be written into. In B2B payments, competitors' own domains are already inside it.
That difference is the most useful thing in this collection. Vendor-owned domains are visibly present in the B2B surface, while no card issuer's own site appears in the consumer arm's leading group. For how trust signals behave more broadly in this vertical, see our fintech trust signals breakdown.
It also changes what a competitive audit looks like. In the consumer arm, the sources you would track are third-party publishers. In the B2B arm, a competitor's own pricing or comparison page is itself a cited source, and it is one they control completely.
Software directories sit in that same B2B group. G2's learn subdomain appears in 18.52% of cited B2B answers and fitsmallbusiness.com in 17.85%, both ahead of Ramp and TechRadar. Those are listing surfaces with their own inclusion processes, separate from editorial pitching.
Turning URL Recurrence Into An Audit List
Domain-level shares tell you who appears. They do not tell you which individual pages keep coming back, which is a separate question this cut was designed to answer.
The trio's citations spread across a wide set of individual pages rather than concentrating. Its most recurrent pages together carry 9.35% of all trio-URL query appearances.
We pre-registered both possible outcomes: a concentrated short list of pages, or a flat portfolio. The measurement returned flat. That distinction was the point of the cut, and it is the extent of what the cut can settle.
The trio URLs that recur across the most distinct queries, in order:
Forbes Advisor's best cash-back credit cards page
Forbes Advisor's best credit cards page
NerdWallet's best corporate credit cards page for business
Forbes Advisor's best corporate credit cards page
NerdWallet's best credit cards page
Forbes Advisor's best payment gateways page for business software
Forbes Advisor's best online personal loans page
Every one is an evergreen category page rather than a news story, a product review, or a launch write-up. The pages that recur are the standing "best X" pages a publisher maintains. Three of the seven are business-vertical URLs, so the B2B roundup layer exists on the same publishers through separate pages. For more on how page type relates to citation, see our breakdown of the most-cited content types.
The pages that recur in these answers are standing category pages, not write-ups about any one company.
The Famous Three Are Not The Most Recurrent Pages
Widen past those three domains and the picture shifts again.
The most recurrent page in the entire collection is a Wall Street Journal buyside personal loans page. It recurs across 2.5 times as many distinct queries as the best-performing trio page, and three further WSJ pages also exceed it.
Investopedia's 2026 credit card awards page recurs at a comparable level, as do mypayadvisor.com's comparisons page and a layer3labs.io comparison page. Those last two are vendor-side comparison content, consistent with what the B2B roster showed.
Reading The Qualifier Test Conditionally
The collection also carried a pre-defined split by question depth, and it comes with tighter limits than the tier contrast.
One arm was short and generic, averaging 4.61 words: "best travel rewards credit cards." The other carried qualifiers, averaging 12.61 words: "best credit card for someone with a 640 score trying to rebuild after a rough year." The two arms were near-equal in size and defined before collection.
The trio appears in 70.17% of head-query cited answers and 45.61% of qualifier-rich ones, a difference of 24.56 percentage points between the two pre-defined arms.
That is an association observed in this sample between two arms we defined in advance. It is not a demonstrated process by which adding qualifiers changes which sources an engine selects, and this collection cannot separate those two readings.
Treat it as conditional evidence about where the trio's presence is strongest in one snapshot. Record your own query set the same way before drawing anything from it.
The practical consequence is about how you build a query set at all. If you only measure short category questions, you are sampling the part of the surface where the trio is strongest, and your audit will overstate how much of your category the roundup layer covers. A set weighted only toward qualifier-rich questions has the mirror problem.
Carry both arms, label them, and never average them into one figure.
Reading The Domain Shares Against A Prior
One more set of numbers, with a caveat that should travel with them everywhere.
Measured across all runs rather than only cited ones, and labeled as a separate denominator: NerdWallet appears in 42.11%, Forbes in 39.93%, the Wall Street Journal in 21.31%, Bankrate in 20.13%, and WalletHub in 15.77%.
Against our June fintech prior, the exact deltas are NerdWallet +19.57, Forbes +19.75, the Wall Street Journal +15.31, Bankrate +10.29, and WalletHub +14.10 percentage points.
Here is why that elevation is weaker evidence than it looks. This query set was built around roundup-shaped questions on purpose, so a comparison against a broad prior is partly measuring our own query design. Use it as context for why the layer deserves attention, never as evidence that the layer grew.
On engine behaviour: ChatGPT triggered a search on 98.88% of its runs here and Google AI Mode on 100% of its own. That is an August 2026 observation rather than a fixed property of either engine, and it is no basis for preferring one.
Keeping The Citation Record Current
All of the above describes one collection at one moment. The version that helps you runs against your own category on a schedule.
Four things decide whether that record is readable a quarter from now:
Split by tier and depth before measuring. Consumer versus business, short versus qualifier-rich. Every result here lives inside those two splits, and a pooled number would have hidden all of them.
Record the URL, not just the domain. "NerdWallet was cited" is not an audit line. The specific page, its type, and how many distinct queries it appears for is.
Watch your own domain in the B2B set. Vendor domains held real share in the B2B arm here, so your own pages are worth tracking as a cited source rather than only as a destination.
Keep denominators separate and labelled. Share of all answers and share of answers that cited something are different numbers, and a denominator change can look exactly like a gain.
Qvery supplies the tracking layer underneath that. It tracks visibility, share of voice, and average rank across ChatGPT and Google AI Mode daily, in over 200 countries, and captures every citation tied to the query and engine that produced it. In Qvery Assistant you can ask about your own visibility, share of voice, citation, topic, and query data, add queries, trigger a run, or export a report.
The source, URL, page-type, and recurrence classification stays yours to maintain alongside those records, which after everything above is where that judgment belongs.
Start your free trial and split your first month of citations by tier and query depth.
Writer's Judgment, Not A Finding
Flagging this clearly, because the rest of the article stays inside what was measured.
Given that the recurring pages are standing category pages rather than articles, our judgment is that an inclusion request aimed at a maintained best-of page is the better ask. Recurrence does not show that such a pitch would succeed, or that inclusion would produce a naming.
Given that vendor domains are visibly present in the B2B surface and absent from the consumer leading group, our judgment is that a B2B fintech should treat its own content as part of the plan next to publisher outreach. That is a view about where effort is likely to be worth spending. Nothing here establishes it causally.
And where competitor answers repeatedly cite a source you have never audited, that absence is worth investigating. It does not show that appearing there will produce a naming.
What the collection did establish is narrower and more durable. The trio appears in 80.61% of cited consumer answers and 35.35% of cited B2B ones, its presence differs by 24.56 percentage points between head and qualifier-rich arms, and its citations spread across a wide set of individual pages rather than concentrating in a handful. Those bounds tell you where the standard advice stops describing your surface.
Every fintech marketer has heard the same advice about AI search: get into the roundups. Get on NerdWallet's best-of list, get into Forbes Advisor, get on Bankrate.
It is a widely held belief and it has not been tested much. So we ran a targeted collection to see which sources co-occur with the answers, and where that belief stops describing what is in front of you.
The short version: the roundup layer is real, it is powerful in one tier and much weaker in another, and it is more spread out than its reputation suggests.
One boundary before any number. This measures which sources appear alongside AI answers. It does not measure whether getting placed on those sites causes an engine to name you, and nothing here was designed to show that.
The Layer Is A Consumer Phenomenon
We treated NerdWallet, Forbes, and Bankrate as a single unit and asked what share of answers cite at least one of them. Then we split that by whether the question came from a consumer or a business buyer.
This is a targeted 149-query recommendation probe collected in August 2026, weighted toward the US (US70/GB15/CA8/AU7). ChatGPT contributes three web-search runs per query and may not search on every run; Google AI Mode contributes one run. Results are a directional snapshot of cited answers, not a causal test of publisher inclusion or brand naming.
In consumer cards and personal loans, 80.61% of answers that cited any source cited at least one of those three. In B2B payments the same figure is 35.35%. Both arms cleared our reporting floor comfortably.
A 2.28 times gap between the two tiers. The trio appears in 80.61% of cited consumer answers against 35.35% of cited B2B ones, which is a different enough surface that one playbook covering both is describing only one of them.
What Occupies B2B Instead
The obvious next question is what appears in the rest of those B2B answers. The composition is more interesting than a thinner version of the same list.
Reddit leads the B2B roster at 28.28% of cited answers, ahead of every editorial publisher in that arm.
Then the part worth reading twice. Sitting third at 25.25% is airwallex.com. Wise appears in 18.86%, Ramp in 15.82%.
Those are vendors, appearing on their own domains, inside answers about the category they compete in.
The consumer arm looks different. Its five leading sources are editorial finance names: Forbes at 60.54%, NerdWallet at 59.52%, the Wall Street Journal at 42.52%, Bankrate at 40.82%, and WalletHub at 28.91%. Reddit and YouTube appear in the consumer roster too, further down. What does not appear in that leading group is a card issuer's own site.
In consumer fintech, the sources leading the cited layer are ones you have to be written into. In B2B payments, competitors' own domains are already inside it.
That difference is the most useful thing in this collection. Vendor-owned domains are visibly present in the B2B surface, while no card issuer's own site appears in the consumer arm's leading group. For how trust signals behave more broadly in this vertical, see our fintech trust signals breakdown.
It also changes what a competitive audit looks like. In the consumer arm, the sources you would track are third-party publishers. In the B2B arm, a competitor's own pricing or comparison page is itself a cited source, and it is one they control completely.
Software directories sit in that same B2B group. G2's learn subdomain appears in 18.52% of cited B2B answers and fitsmallbusiness.com in 17.85%, both ahead of Ramp and TechRadar. Those are listing surfaces with their own inclusion processes, separate from editorial pitching.
Turning URL Recurrence Into An Audit List
Domain-level shares tell you who appears. They do not tell you which individual pages keep coming back, which is a separate question this cut was designed to answer.
The trio's citations spread across a wide set of individual pages rather than concentrating. Its most recurrent pages together carry 9.35% of all trio-URL query appearances.
We pre-registered both possible outcomes: a concentrated short list of pages, or a flat portfolio. The measurement returned flat. That distinction was the point of the cut, and it is the extent of what the cut can settle.
The trio URLs that recur across the most distinct queries, in order:
Forbes Advisor's best cash-back credit cards page
Forbes Advisor's best credit cards page
NerdWallet's best corporate credit cards page for business
Forbes Advisor's best corporate credit cards page
NerdWallet's best credit cards page
Forbes Advisor's best payment gateways page for business software
Forbes Advisor's best online personal loans page
Every one is an evergreen category page rather than a news story, a product review, or a launch write-up. The pages that recur are the standing "best X" pages a publisher maintains. Three of the seven are business-vertical URLs, so the B2B roundup layer exists on the same publishers through separate pages. For more on how page type relates to citation, see our breakdown of the most-cited content types.
The pages that recur in these answers are standing category pages, not write-ups about any one company.
The Famous Three Are Not The Most Recurrent Pages
Widen past those three domains and the picture shifts again.
The most recurrent page in the entire collection is a Wall Street Journal buyside personal loans page. It recurs across 2.5 times as many distinct queries as the best-performing trio page, and three further WSJ pages also exceed it.
Investopedia's 2026 credit card awards page recurs at a comparable level, as do mypayadvisor.com's comparisons page and a layer3labs.io comparison page. Those last two are vendor-side comparison content, consistent with what the B2B roster showed.
Reading The Qualifier Test Conditionally
The collection also carried a pre-defined split by question depth, and it comes with tighter limits than the tier contrast.
One arm was short and generic, averaging 4.61 words: "best travel rewards credit cards." The other carried qualifiers, averaging 12.61 words: "best credit card for someone with a 640 score trying to rebuild after a rough year." The two arms were near-equal in size and defined before collection.
The trio appears in 70.17% of head-query cited answers and 45.61% of qualifier-rich ones, a difference of 24.56 percentage points between the two pre-defined arms.
That is an association observed in this sample between two arms we defined in advance. It is not a demonstrated process by which adding qualifiers changes which sources an engine selects, and this collection cannot separate those two readings.
Treat it as conditional evidence about where the trio's presence is strongest in one snapshot. Record your own query set the same way before drawing anything from it.
The practical consequence is about how you build a query set at all. If you only measure short category questions, you are sampling the part of the surface where the trio is strongest, and your audit will overstate how much of your category the roundup layer covers. A set weighted only toward qualifier-rich questions has the mirror problem.
Carry both arms, label them, and never average them into one figure.
Reading The Domain Shares Against A Prior
One more set of numbers, with a caveat that should travel with them everywhere.
Measured across all runs rather than only cited ones, and labeled as a separate denominator: NerdWallet appears in 42.11%, Forbes in 39.93%, the Wall Street Journal in 21.31%, Bankrate in 20.13%, and WalletHub in 15.77%.
Against our June fintech prior, the exact deltas are NerdWallet +19.57, Forbes +19.75, the Wall Street Journal +15.31, Bankrate +10.29, and WalletHub +14.10 percentage points.
Here is why that elevation is weaker evidence than it looks. This query set was built around roundup-shaped questions on purpose, so a comparison against a broad prior is partly measuring our own query design. Use it as context for why the layer deserves attention, never as evidence that the layer grew.
On engine behaviour: ChatGPT triggered a search on 98.88% of its runs here and Google AI Mode on 100% of its own. That is an August 2026 observation rather than a fixed property of either engine, and it is no basis for preferring one.
Keeping The Citation Record Current
All of the above describes one collection at one moment. The version that helps you runs against your own category on a schedule.
Four things decide whether that record is readable a quarter from now:
Split by tier and depth before measuring. Consumer versus business, short versus qualifier-rich. Every result here lives inside those two splits, and a pooled number would have hidden all of them.
Record the URL, not just the domain. "NerdWallet was cited" is not an audit line. The specific page, its type, and how many distinct queries it appears for is.
Watch your own domain in the B2B set. Vendor domains held real share in the B2B arm here, so your own pages are worth tracking as a cited source rather than only as a destination.
Keep denominators separate and labelled. Share of all answers and share of answers that cited something are different numbers, and a denominator change can look exactly like a gain.
Qvery supplies the tracking layer underneath that. It tracks visibility, share of voice, and average rank across ChatGPT and Google AI Mode daily, in over 200 countries, and captures every citation tied to the query and engine that produced it. In Qvery Assistant you can ask about your own visibility, share of voice, citation, topic, and query data, add queries, trigger a run, or export a report.
The source, URL, page-type, and recurrence classification stays yours to maintain alongside those records, which after everything above is where that judgment belongs.
Start your free trial and split your first month of citations by tier and query depth.
Writer's Judgment, Not A Finding
Flagging this clearly, because the rest of the article stays inside what was measured.
Given that the recurring pages are standing category pages rather than articles, our judgment is that an inclusion request aimed at a maintained best-of page is the better ask. Recurrence does not show that such a pitch would succeed, or that inclusion would produce a naming.
Given that vendor domains are visibly present in the B2B surface and absent from the consumer leading group, our judgment is that a B2B fintech should treat its own content as part of the plan next to publisher outreach. That is a view about where effort is likely to be worth spending. Nothing here establishes it causally.
And where competitor answers repeatedly cite a source you have never audited, that absence is worth investigating. It does not show that appearing there will produce a naming.
What the collection did establish is narrower and more durable. The trio appears in 80.61% of cited consumer answers and 35.35% of cited B2B ones, its presence differs by 24.56 percentage points between head and qualifier-rich arms, and its citations spread across a wide set of individual pages rather than concentrating in a handful. Those bounds tell you where the standard advice stops describing your surface.
Every fintech marketer has heard the same advice about AI search: get into the roundups. Get on NerdWallet's best-of list, get into Forbes Advisor, get on Bankrate.
It is a widely held belief and it has not been tested much. So we ran a targeted collection to see which sources co-occur with the answers, and where that belief stops describing what is in front of you.
The short version: the roundup layer is real, it is powerful in one tier and much weaker in another, and it is more spread out than its reputation suggests.
One boundary before any number. This measures which sources appear alongside AI answers. It does not measure whether getting placed on those sites causes an engine to name you, and nothing here was designed to show that.
The Layer Is A Consumer Phenomenon
We treated NerdWallet, Forbes, and Bankrate as a single unit and asked what share of answers cite at least one of them. Then we split that by whether the question came from a consumer or a business buyer.
This is a targeted 149-query recommendation probe collected in August 2026, weighted toward the US (US70/GB15/CA8/AU7). ChatGPT contributes three web-search runs per query and may not search on every run; Google AI Mode contributes one run. Results are a directional snapshot of cited answers, not a causal test of publisher inclusion or brand naming.
In consumer cards and personal loans, 80.61% of answers that cited any source cited at least one of those three. In B2B payments the same figure is 35.35%. Both arms cleared our reporting floor comfortably.
A 2.28 times gap between the two tiers. The trio appears in 80.61% of cited consumer answers against 35.35% of cited B2B ones, which is a different enough surface that one playbook covering both is describing only one of them.
What Occupies B2B Instead
The obvious next question is what appears in the rest of those B2B answers. The composition is more interesting than a thinner version of the same list.
Reddit leads the B2B roster at 28.28% of cited answers, ahead of every editorial publisher in that arm.
Then the part worth reading twice. Sitting third at 25.25% is airwallex.com. Wise appears in 18.86%, Ramp in 15.82%.
Those are vendors, appearing on their own domains, inside answers about the category they compete in.
The consumer arm looks different. Its five leading sources are editorial finance names: Forbes at 60.54%, NerdWallet at 59.52%, the Wall Street Journal at 42.52%, Bankrate at 40.82%, and WalletHub at 28.91%. Reddit and YouTube appear in the consumer roster too, further down. What does not appear in that leading group is a card issuer's own site.
In consumer fintech, the sources leading the cited layer are ones you have to be written into. In B2B payments, competitors' own domains are already inside it.
That difference is the most useful thing in this collection. Vendor-owned domains are visibly present in the B2B surface, while no card issuer's own site appears in the consumer arm's leading group. For how trust signals behave more broadly in this vertical, see our fintech trust signals breakdown.
It also changes what a competitive audit looks like. In the consumer arm, the sources you would track are third-party publishers. In the B2B arm, a competitor's own pricing or comparison page is itself a cited source, and it is one they control completely.
Software directories sit in that same B2B group. G2's learn subdomain appears in 18.52% of cited B2B answers and fitsmallbusiness.com in 17.85%, both ahead of Ramp and TechRadar. Those are listing surfaces with their own inclusion processes, separate from editorial pitching.
Turning URL Recurrence Into An Audit List
Domain-level shares tell you who appears. They do not tell you which individual pages keep coming back, which is a separate question this cut was designed to answer.
The trio's citations spread across a wide set of individual pages rather than concentrating. Its most recurrent pages together carry 9.35% of all trio-URL query appearances.
We pre-registered both possible outcomes: a concentrated short list of pages, or a flat portfolio. The measurement returned flat. That distinction was the point of the cut, and it is the extent of what the cut can settle.
The trio URLs that recur across the most distinct queries, in order:
Forbes Advisor's best cash-back credit cards page
Forbes Advisor's best credit cards page
NerdWallet's best corporate credit cards page for business
Forbes Advisor's best corporate credit cards page
NerdWallet's best credit cards page
Forbes Advisor's best payment gateways page for business software
Forbes Advisor's best online personal loans page
Every one is an evergreen category page rather than a news story, a product review, or a launch write-up. The pages that recur are the standing "best X" pages a publisher maintains. Three of the seven are business-vertical URLs, so the B2B roundup layer exists on the same publishers through separate pages. For more on how page type relates to citation, see our breakdown of the most-cited content types.
The pages that recur in these answers are standing category pages, not write-ups about any one company.
The Famous Three Are Not The Most Recurrent Pages
Widen past those three domains and the picture shifts again.
The most recurrent page in the entire collection is a Wall Street Journal buyside personal loans page. It recurs across 2.5 times as many distinct queries as the best-performing trio page, and three further WSJ pages also exceed it.
Investopedia's 2026 credit card awards page recurs at a comparable level, as do mypayadvisor.com's comparisons page and a layer3labs.io comparison page. Those last two are vendor-side comparison content, consistent with what the B2B roster showed.
Reading The Qualifier Test Conditionally
The collection also carried a pre-defined split by question depth, and it comes with tighter limits than the tier contrast.
One arm was short and generic, averaging 4.61 words: "best travel rewards credit cards." The other carried qualifiers, averaging 12.61 words: "best credit card for someone with a 640 score trying to rebuild after a rough year." The two arms were near-equal in size and defined before collection.
The trio appears in 70.17% of head-query cited answers and 45.61% of qualifier-rich ones, a difference of 24.56 percentage points between the two pre-defined arms.
That is an association observed in this sample between two arms we defined in advance. It is not a demonstrated process by which adding qualifiers changes which sources an engine selects, and this collection cannot separate those two readings.
Treat it as conditional evidence about where the trio's presence is strongest in one snapshot. Record your own query set the same way before drawing anything from it.
The practical consequence is about how you build a query set at all. If you only measure short category questions, you are sampling the part of the surface where the trio is strongest, and your audit will overstate how much of your category the roundup layer covers. A set weighted only toward qualifier-rich questions has the mirror problem.
Carry both arms, label them, and never average them into one figure.
Reading The Domain Shares Against A Prior
One more set of numbers, with a caveat that should travel with them everywhere.
Measured across all runs rather than only cited ones, and labeled as a separate denominator: NerdWallet appears in 42.11%, Forbes in 39.93%, the Wall Street Journal in 21.31%, Bankrate in 20.13%, and WalletHub in 15.77%.
Against our June fintech prior, the exact deltas are NerdWallet +19.57, Forbes +19.75, the Wall Street Journal +15.31, Bankrate +10.29, and WalletHub +14.10 percentage points.
Here is why that elevation is weaker evidence than it looks. This query set was built around roundup-shaped questions on purpose, so a comparison against a broad prior is partly measuring our own query design. Use it as context for why the layer deserves attention, never as evidence that the layer grew.
On engine behaviour: ChatGPT triggered a search on 98.88% of its runs here and Google AI Mode on 100% of its own. That is an August 2026 observation rather than a fixed property of either engine, and it is no basis for preferring one.
Keeping The Citation Record Current
All of the above describes one collection at one moment. The version that helps you runs against your own category on a schedule.
Four things decide whether that record is readable a quarter from now:
Split by tier and depth before measuring. Consumer versus business, short versus qualifier-rich. Every result here lives inside those two splits, and a pooled number would have hidden all of them.
Record the URL, not just the domain. "NerdWallet was cited" is not an audit line. The specific page, its type, and how many distinct queries it appears for is.
Watch your own domain in the B2B set. Vendor domains held real share in the B2B arm here, so your own pages are worth tracking as a cited source rather than only as a destination.
Keep denominators separate and labelled. Share of all answers and share of answers that cited something are different numbers, and a denominator change can look exactly like a gain.
Qvery supplies the tracking layer underneath that. It tracks visibility, share of voice, and average rank across ChatGPT and Google AI Mode daily, in over 200 countries, and captures every citation tied to the query and engine that produced it. In Qvery Assistant you can ask about your own visibility, share of voice, citation, topic, and query data, add queries, trigger a run, or export a report.
The source, URL, page-type, and recurrence classification stays yours to maintain alongside those records, which after everything above is where that judgment belongs.
Start your free trial and split your first month of citations by tier and query depth.
Writer's Judgment, Not A Finding
Flagging this clearly, because the rest of the article stays inside what was measured.
Given that the recurring pages are standing category pages rather than articles, our judgment is that an inclusion request aimed at a maintained best-of page is the better ask. Recurrence does not show that such a pitch would succeed, or that inclusion would produce a naming.
Given that vendor domains are visibly present in the B2B surface and absent from the consumer leading group, our judgment is that a B2B fintech should treat its own content as part of the plan next to publisher outreach. That is a view about where effort is likely to be worth spending. Nothing here establishes it causally.
And where competitor answers repeatedly cite a source you have never audited, that absence is worth investigating. It does not show that appearing there will produce a naming.
What the collection did establish is narrower and more durable. The trio appears in 80.61% of cited consumer answers and 35.35% of cited B2B ones, its presence differs by 24.56 percentage points between head and qualifier-rich arms, and its citations spread across a wide set of individual pages rather than concentrating in a handful. Those bounds tell you where the standard advice stops describing your surface.

© 2026 Qvery AI OÜ