By
Vlad Shvets
Qvery Webinar #7: Reporting On AI Engine Visibility
In our seventh Qvery webinar, we covered a topic that sounds dull on the surface and is in fact one of the most consequential things marketers get wrong: how to report on AI engine visibility. Most teams default to staring at the dashboard, feeling vaguely concerned about whichever number went down today, and calling that a report. That is not a report. That is a hostage situation.
A real report tells you whether to ship more content this month or kill a campaign. The difference between the two comes down to two things: which metrics you actually look at, and how often you look at them.
If you missed webinar five, that's the foundation for everything in this post. Qvery Assistant is where real reports come from. The dashboard is a snapshot. Everything we'll walk through here runs one layer deeper, inside the Assistant.
The Three Metrics Worth Reporting On
Out of the dozen numbers on a Qvery dashboard, three actually matter for reporting.
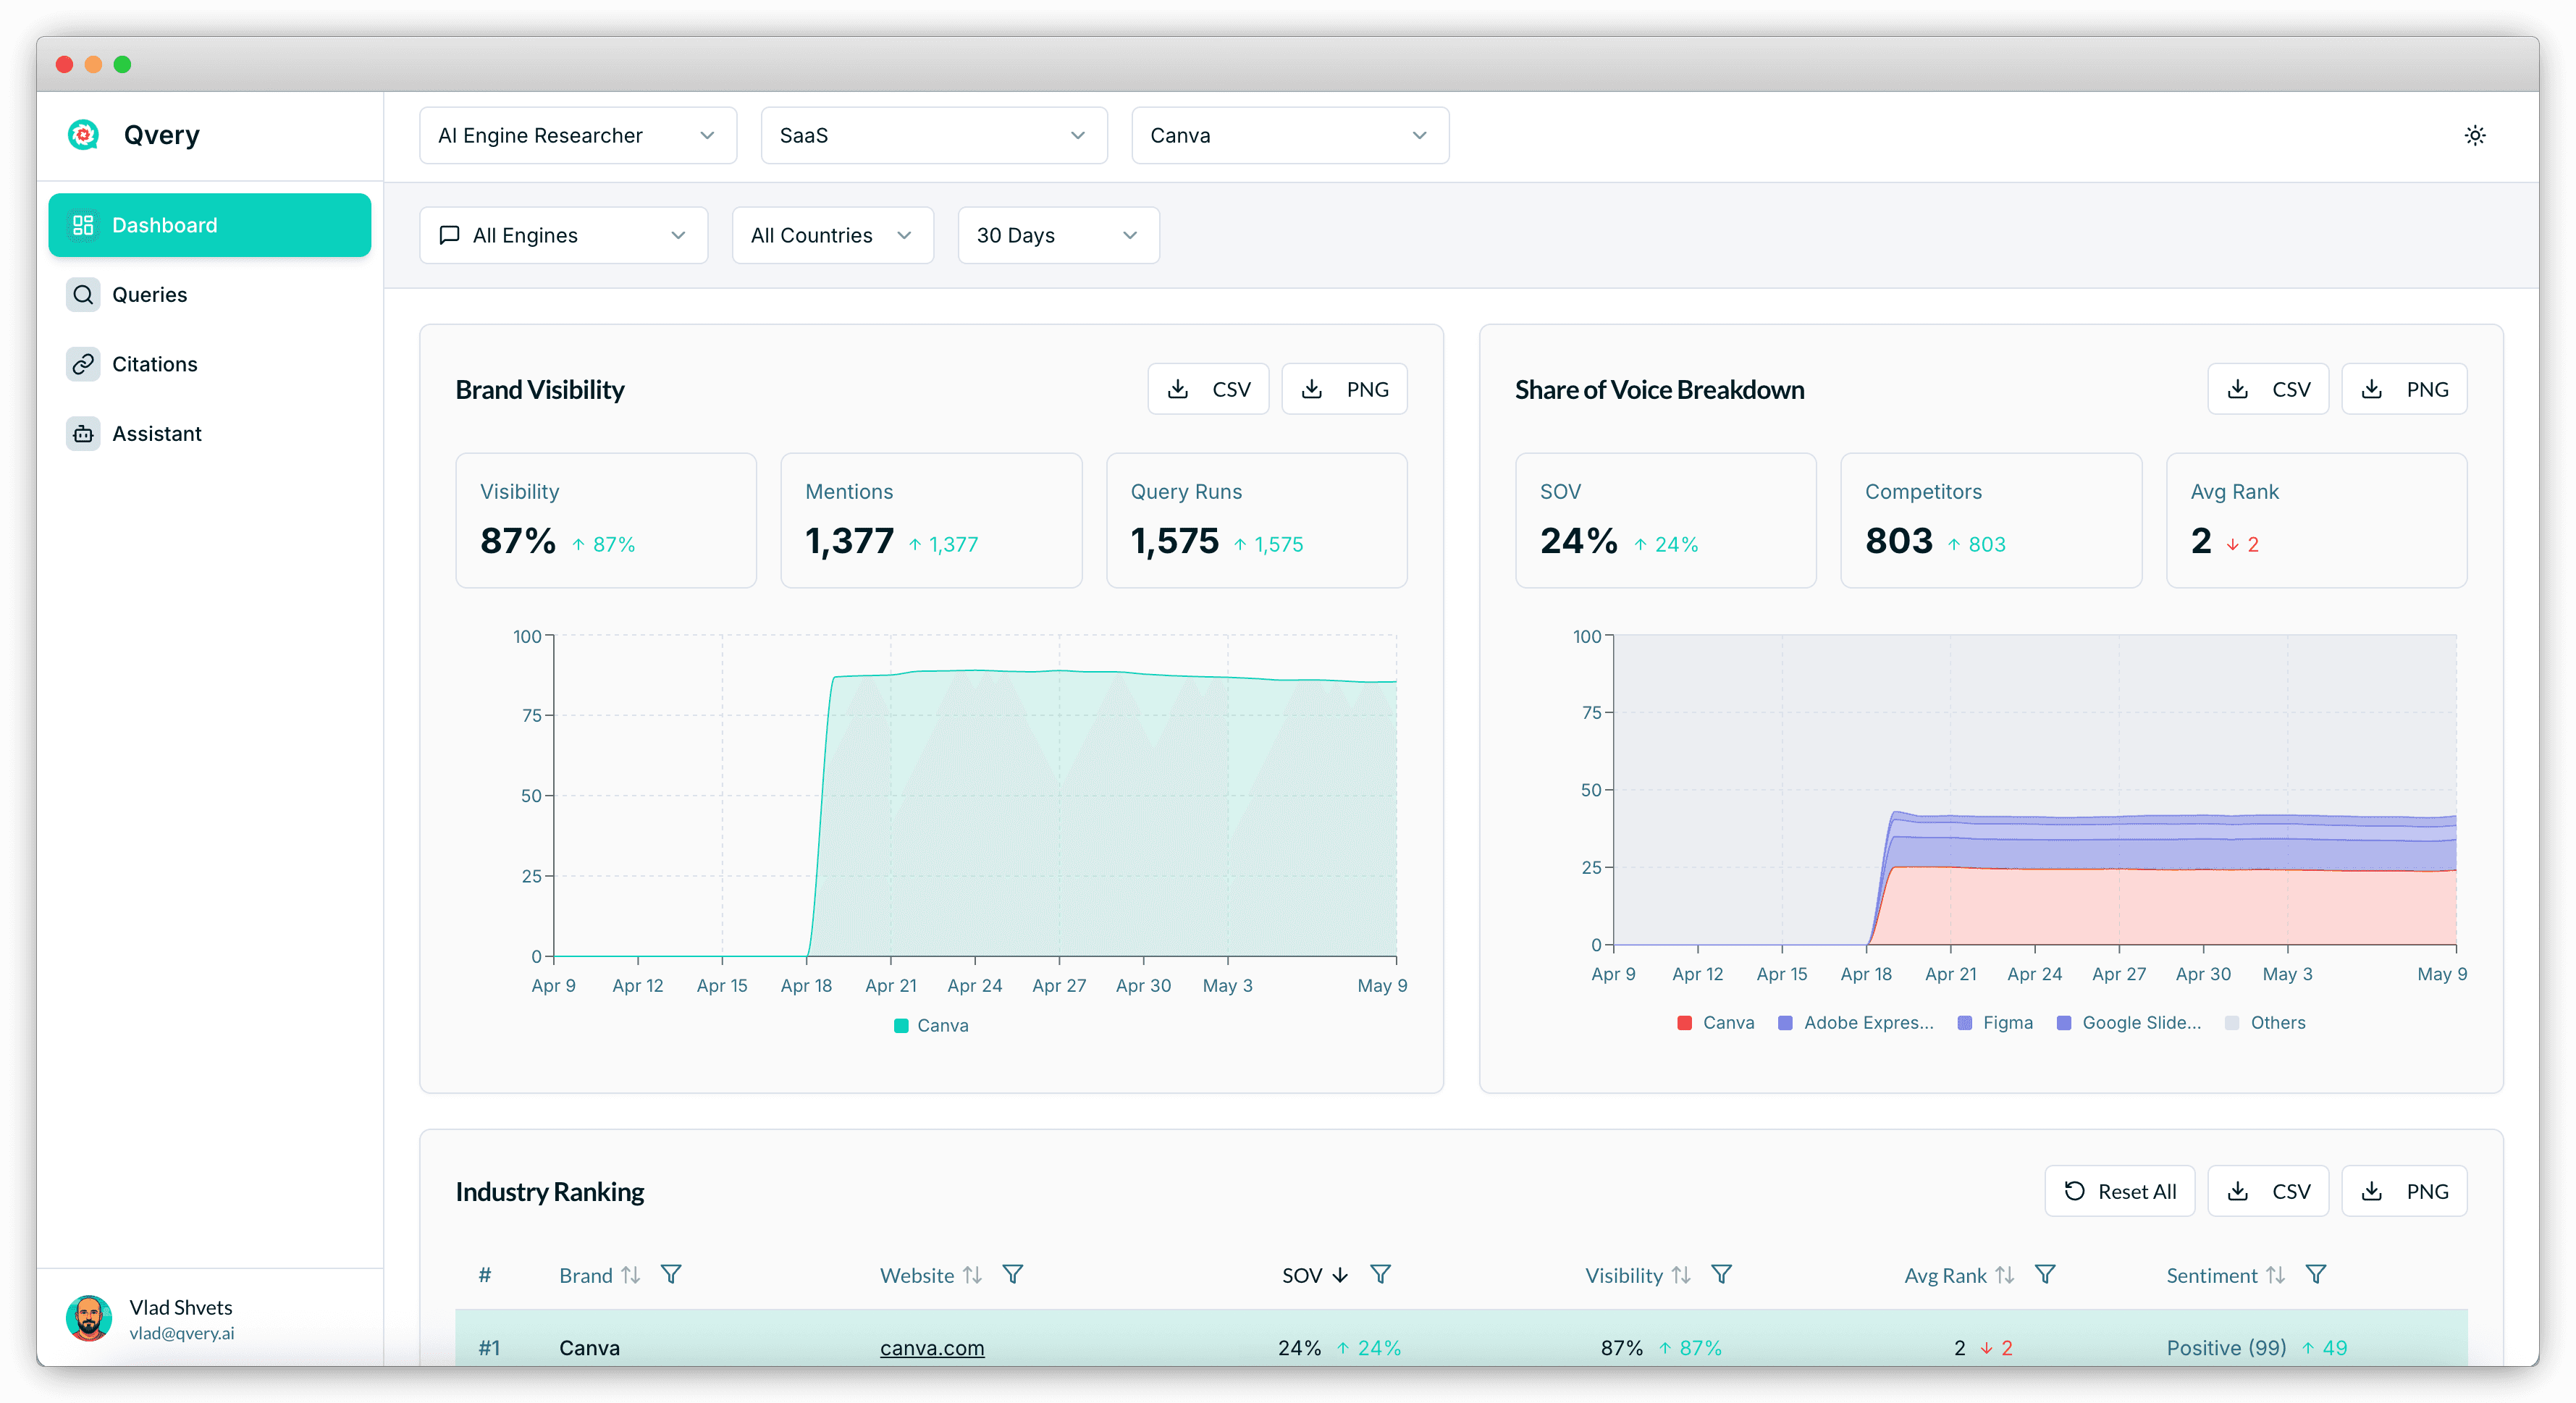
Brand visibility. The percentage of tracked queries where your brand was mentioned at least once. Canva sits at 87 percent in our demo account, which is excellent. This is the simplest metric to grasp and the easiest to overweight — you can be mentioned in every response and still be invisible if you're always at the bottom of the list.
Share of voice. The percentage of total brand mentions in your industry that belong to you, weighted by rank. Canva's 24 percent share of voice is a long way from its 87 percent visibility number — and that gap is the most useful data point on the dashboard. Visibility tells you whether you showed up to the party. Share of voice tells you whether anyone was listening when you walked in.
Average rank. Where you sit in the recommendation list when you do appear. Canva averages position two. Brands with high visibility and average rank four or five are losing every comparison even though they technically "showed up."
If your monthly report leads with visibility and never mentions the other two, you're reporting on whether you exist — not whether you're winning.
Why Reporting Cadence Is The Trap
The single most common mistake we see is teams reporting on AI engine visibility daily. Daily looks rigorous. Daily looks like you're on top of things. Daily is wrong.
AI search is probabilistic, not deterministic. The same query you ran today on ChatGPT can come back with a different list of recommendations tomorrow even if absolutely nothing changed about your brand or your competitors. That's not a bug. That's how generative models work. They sample from a distribution; the distribution shifts. If you report on yesterday's snapshot like it's gospel, you'll spend your week chasing noise.
Decisions live on a weekly cadence. Weekly is the floor. Monthly is the right rhythm for executive reporting. Quarterly is when you decide whether the whole strategy is working.
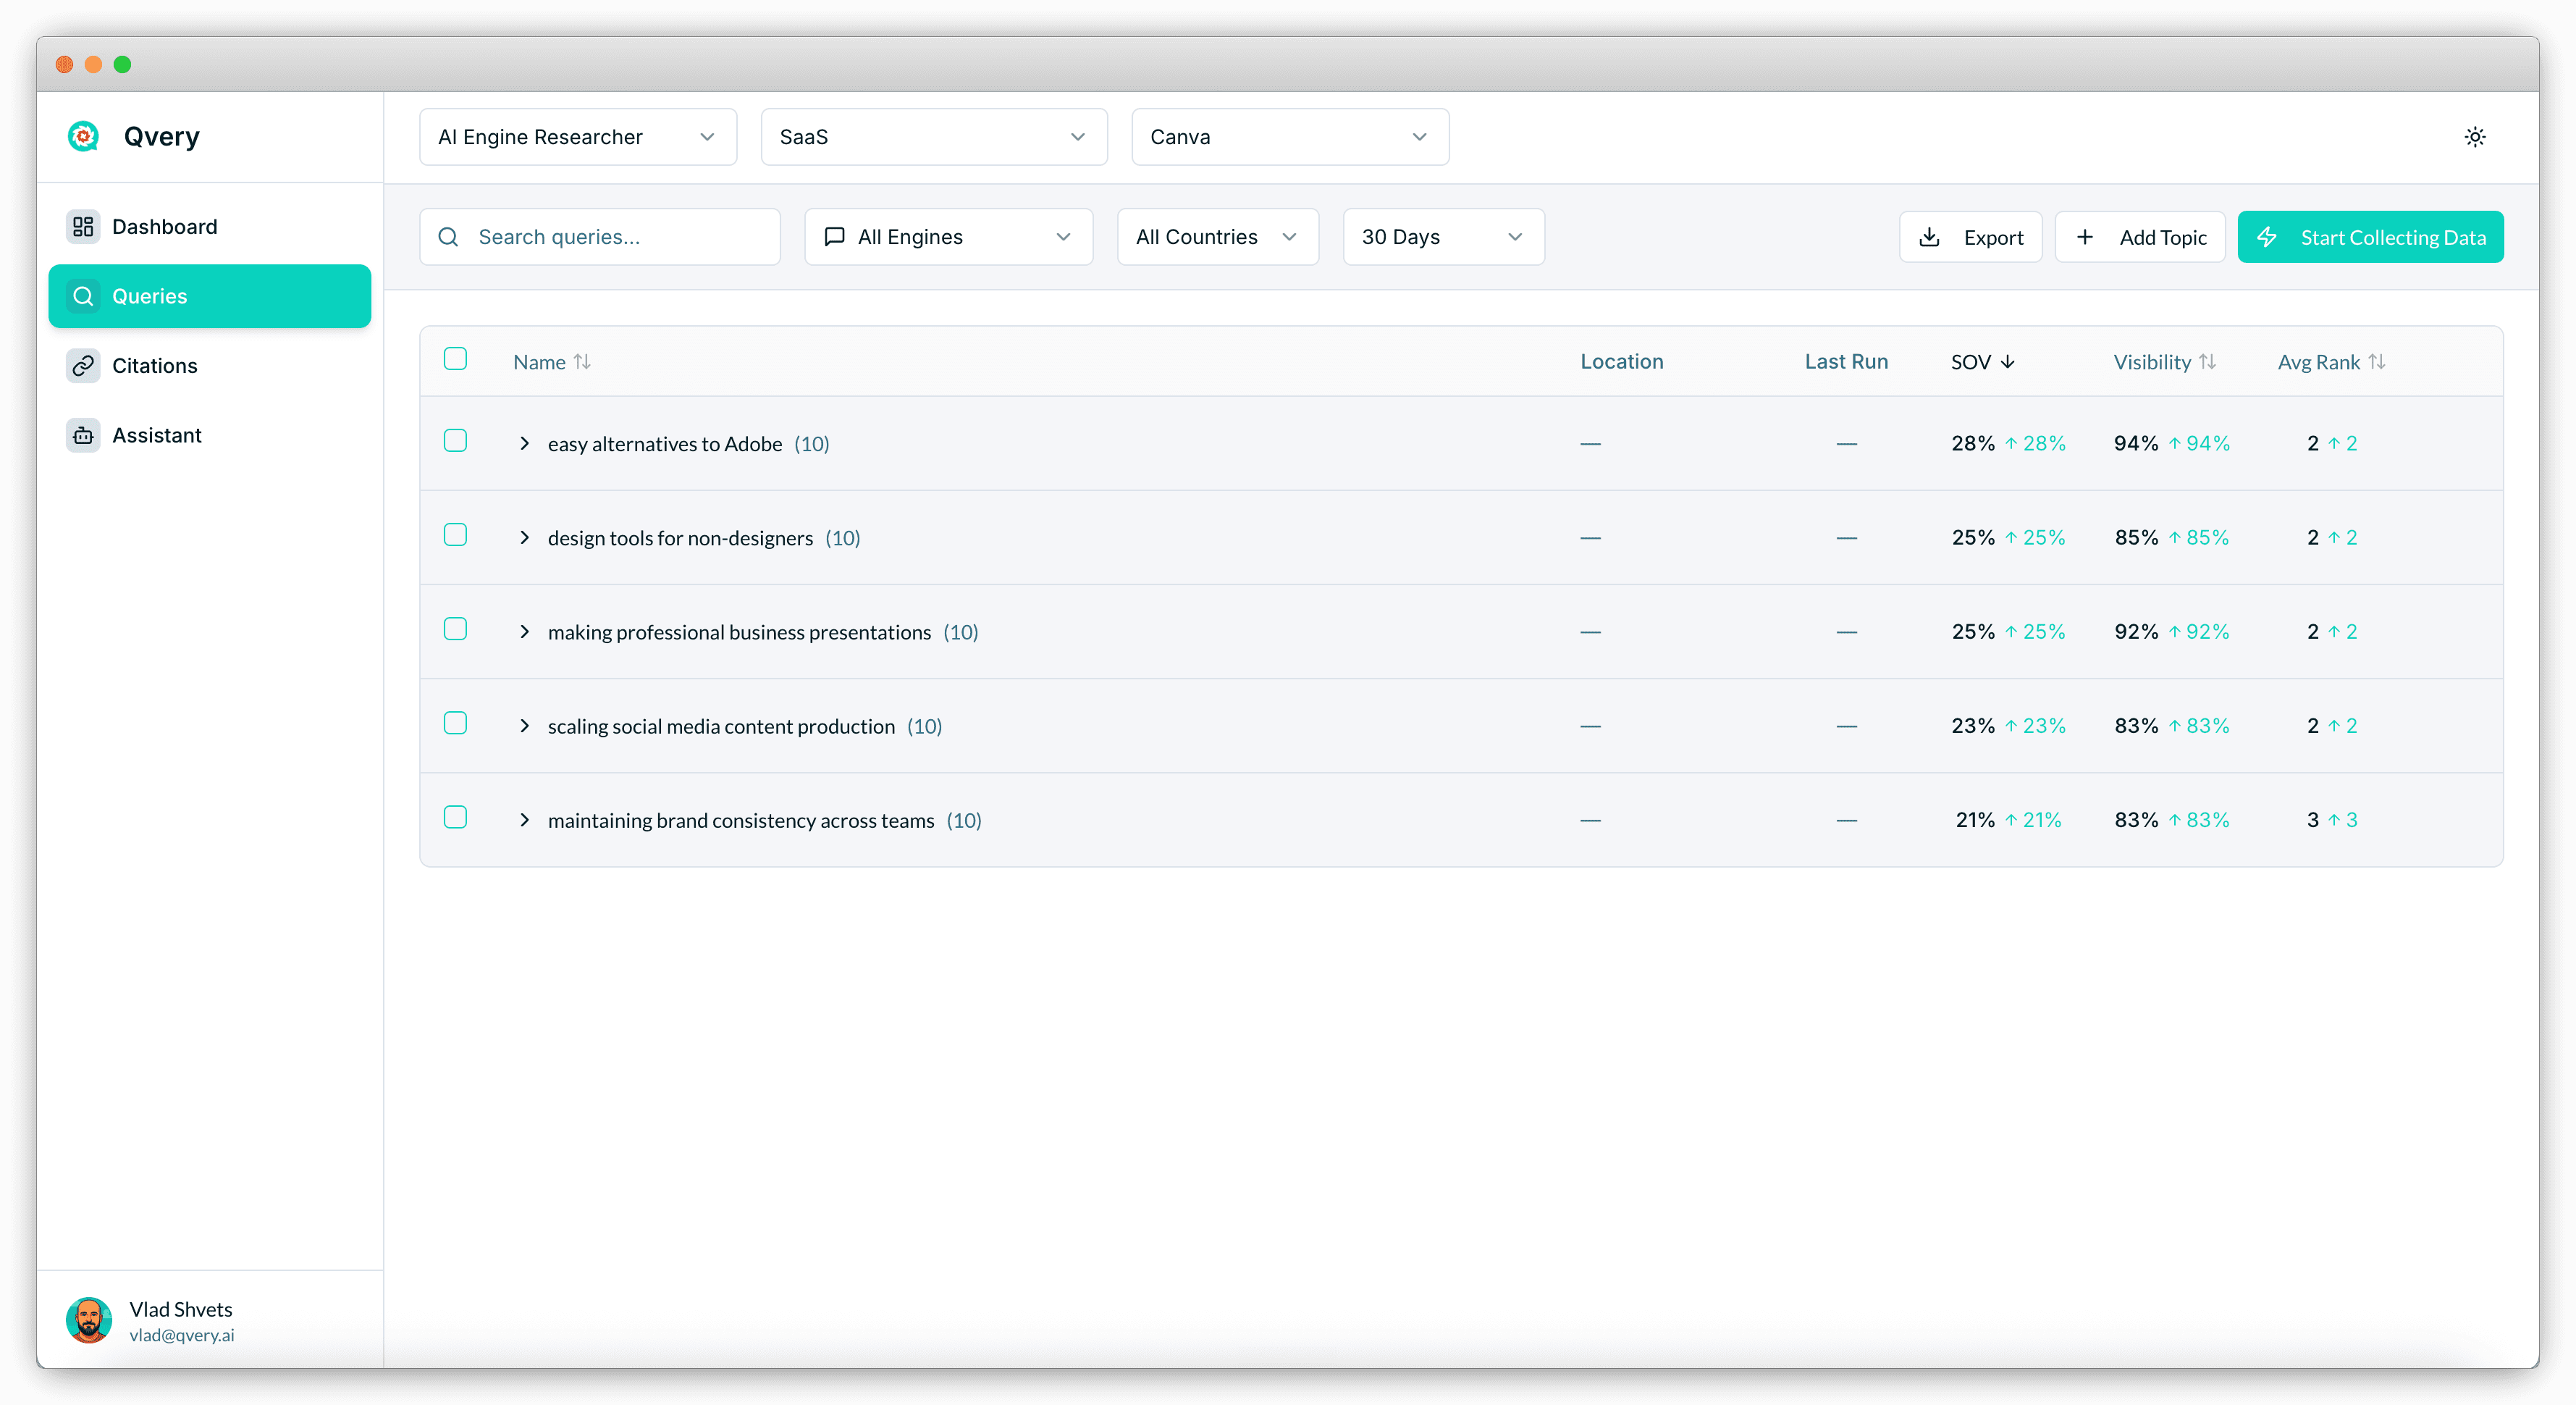
This is the actual underlying dataset for Canva — 50 queries across five topics, run daily on both ChatGPT and Google AI Mode. Hundreds of executions every week. The weekly average is the signal. Any single day is one sample from a probability distribution that none of us fully understand. And no, "I'll just take more samples per day" doesn't fix the problem — that's why we wait a week.
Level One, Level Two, And Level Three Questions
When we designed Qvery Assistant, we sorted every question a marketer might ask about their data into three buckets. The same framework is the right way to structure a report.
Level one questions are things the dashboard already answers. "What's my visibility this week?" "Who's the top competitor in my industry ranking?" If you're spending real time on level one in a report, your report is mostly screenshots. There's no analytical work happening — you're just narrating a chart.
Level two questions are technically answerable as a human, but require cross-referencing modules, sorting columns, and keeping six numbers in your head at once. "Which topics drove my share of voice growth this month, and which competitors lost ground in those topics?" You can answer it. You just need an hour, two browser tabs, and a tolerance for tab-switching that the rest of us lost somewhere around 2024.
Level three questions are basically impossible to answer manually. "Of the competitors whose visibility is growing, which topics drove that growth, which citations sit underneath those topics, and which of those citations don't yet mention me?" That's a five-dimensional query across thousands of data points. Humans cannot do this. AI can do it in seconds.
The best reports are mostly level three. Level one is a paragraph of context at the top. Level two is the framing of the narrative. Level three is where the post-mortem happens, the surprises live, and the next-month decisions actually get made.
Three Templates That Run Your Reports For You
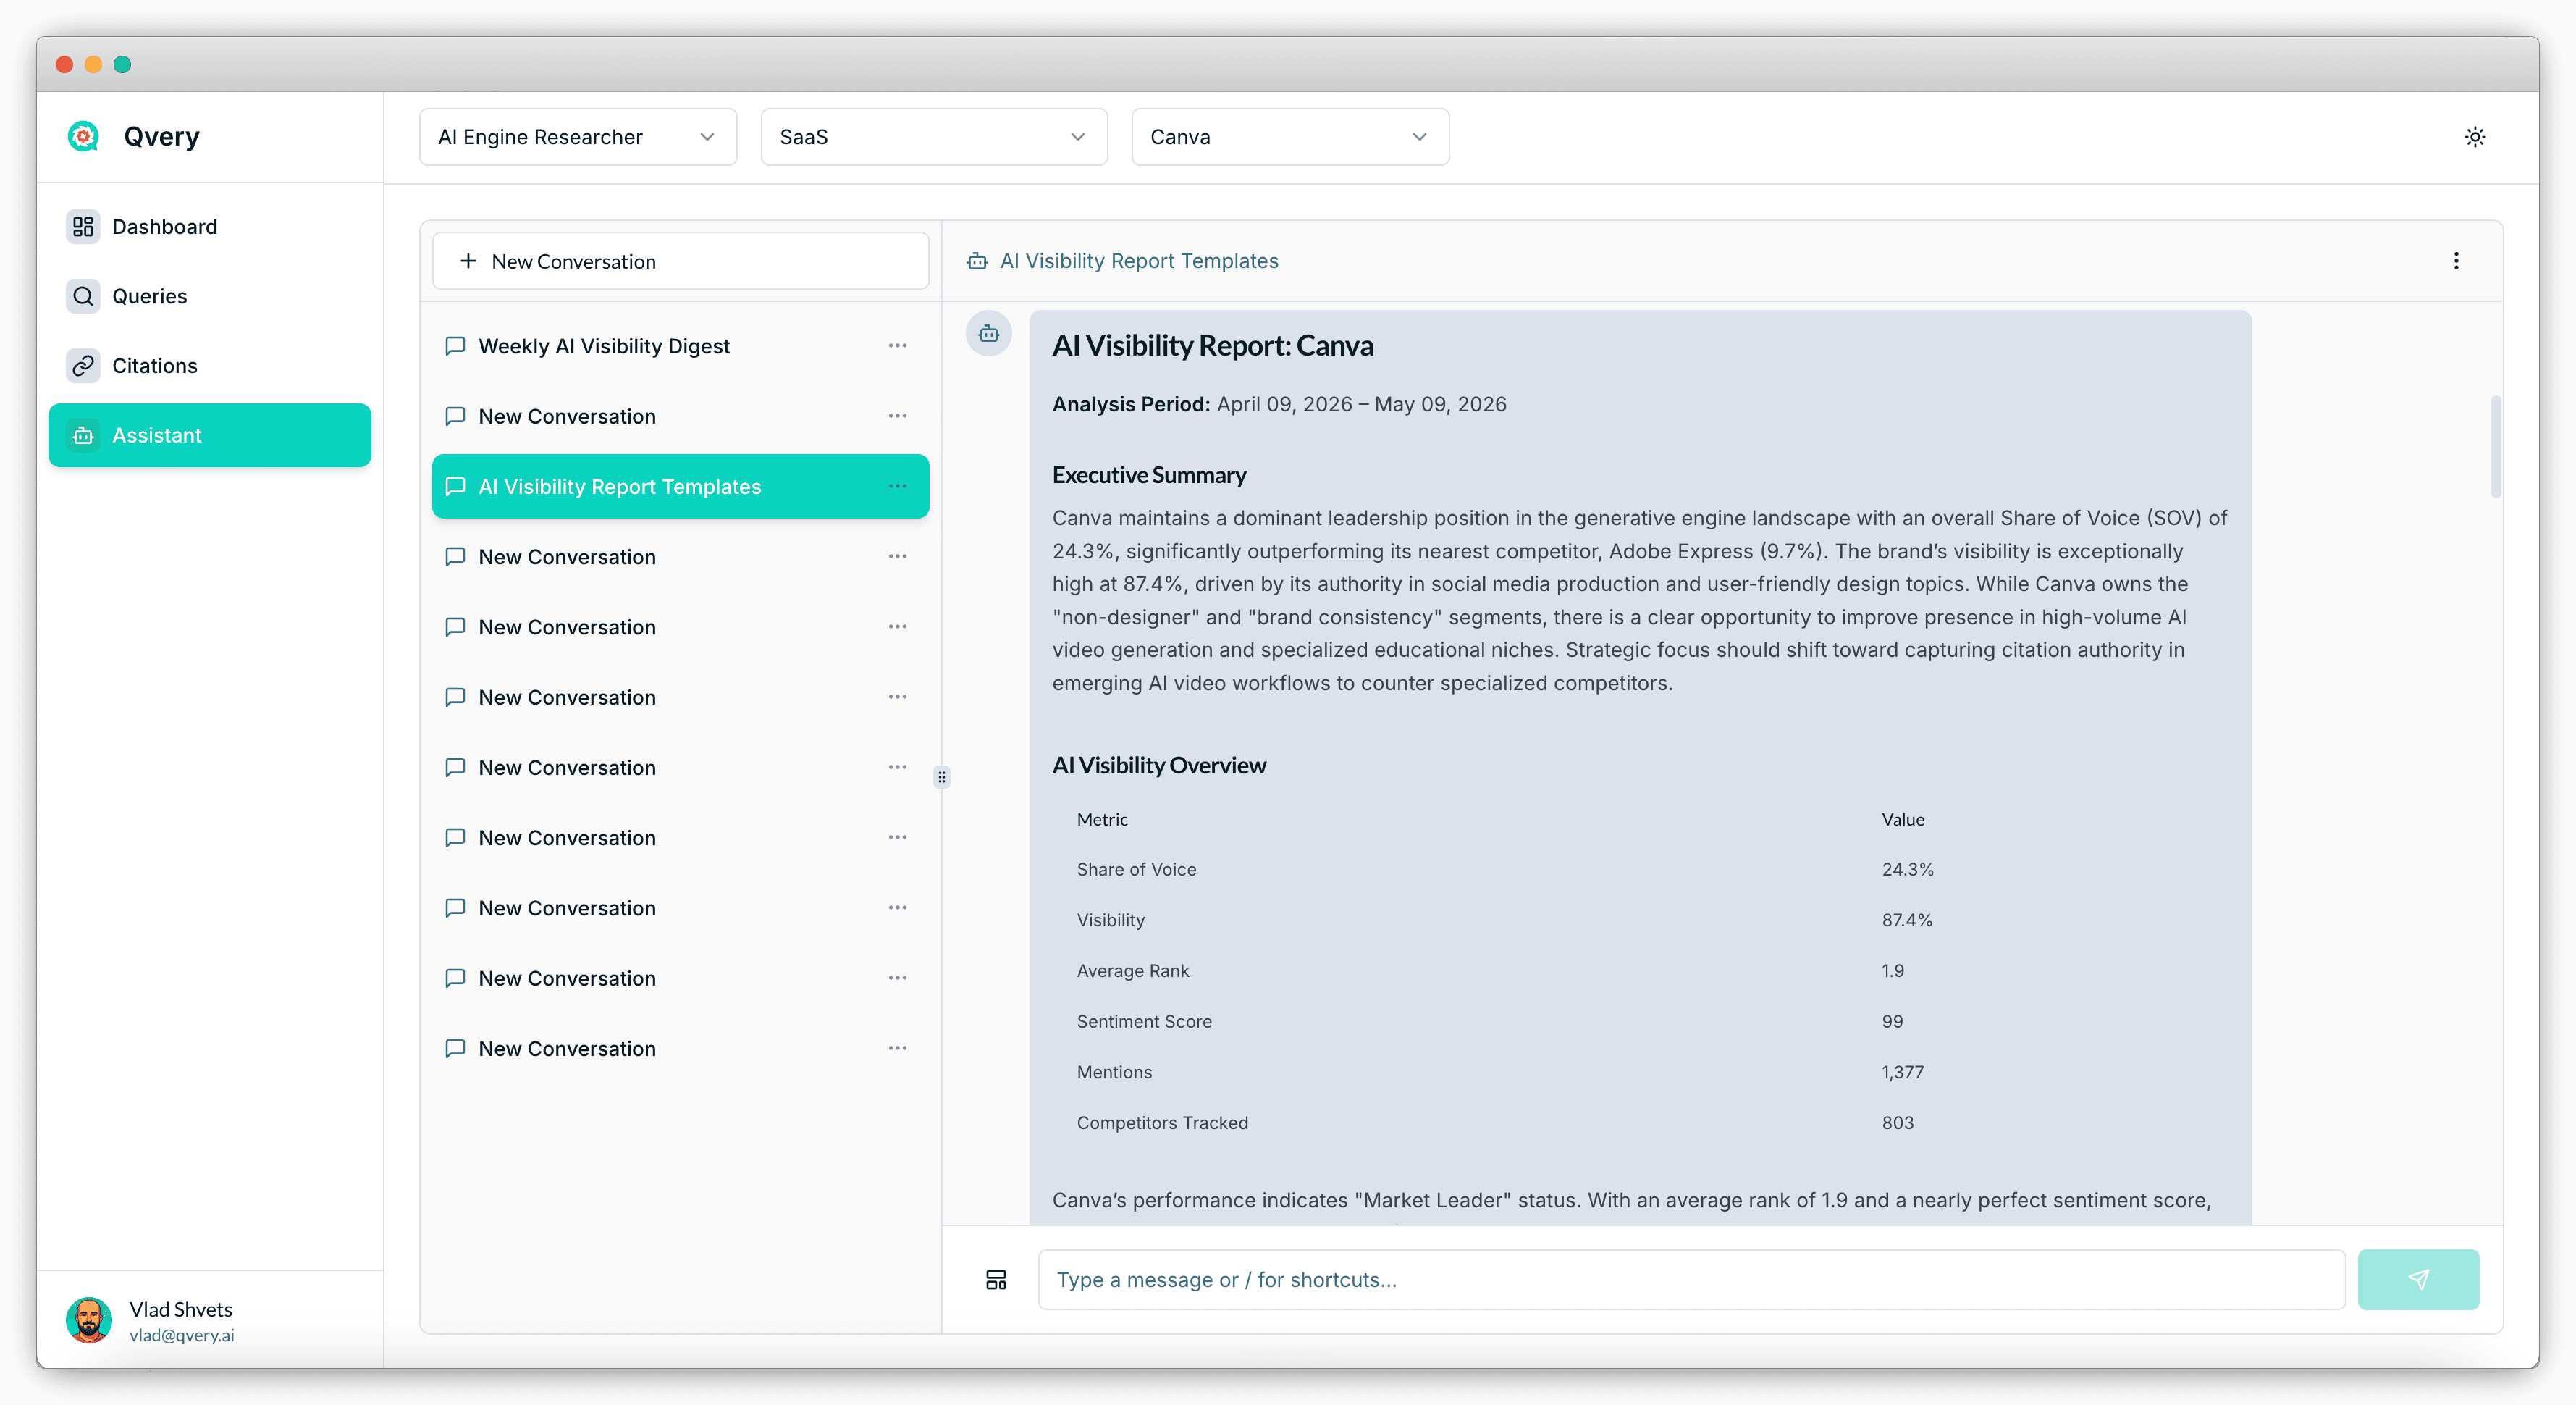
Qvery Assistant ships three reporting templates that cover most of what a B2B marketing team needs every month. Run them inside the Assistant chat and each one outputs a full structured report in under a minute. No screenshots, no copying numbers between Slides and Sheets — which, depending on your week, can feel like the entire job.
AI Visibility Report. The flagship. A comprehensive 30-day pass across visibility, share of voice, average rank, topic-level performance, and competitive positioning. This is the report you send to your CEO every month.
Monthly Visibility Report. A leaner cousin. Same metrics over the past 30 days but without the time-period customization. Faster to generate, easier to ship as a recurring deliverable.
Weekly Digest Report. The week-over-week version. Smaller dataset, fewer insights per run, but the right cadence for active campaign management.
The output is markdown by default. Copy it into Slack, paste it into a Notion doc, or — and this is the move — ask the Assistant to rewrite it as an email to your board. The data stays the same. The format gets shaped to the audience. Templates are free to run inside any Qvery account, with no caps on how often you run them. Set a recurring calendar reminder, run the right one every Monday, and stop manually writing reports forever.
Where The Real Insights Live
The templates handle the standard set. For everything else — sentiment, narrative comparisons, custom competitive deep dives — you ask Qvery Assistant directly. This is where level three work actually happens.
A live example from the webinar: "Generate me a sentiment analysis report comparing my brand versus competitors." There is no built-in sentiment template at the time of writing. There doesn't need to be. The Assistant has access to every response text in your account, including the surrounding language each AI engine uses to describe each brand. It analyzes the data, builds a competitive table, and outputs a verdict — without you ever opening a spreadsheet.
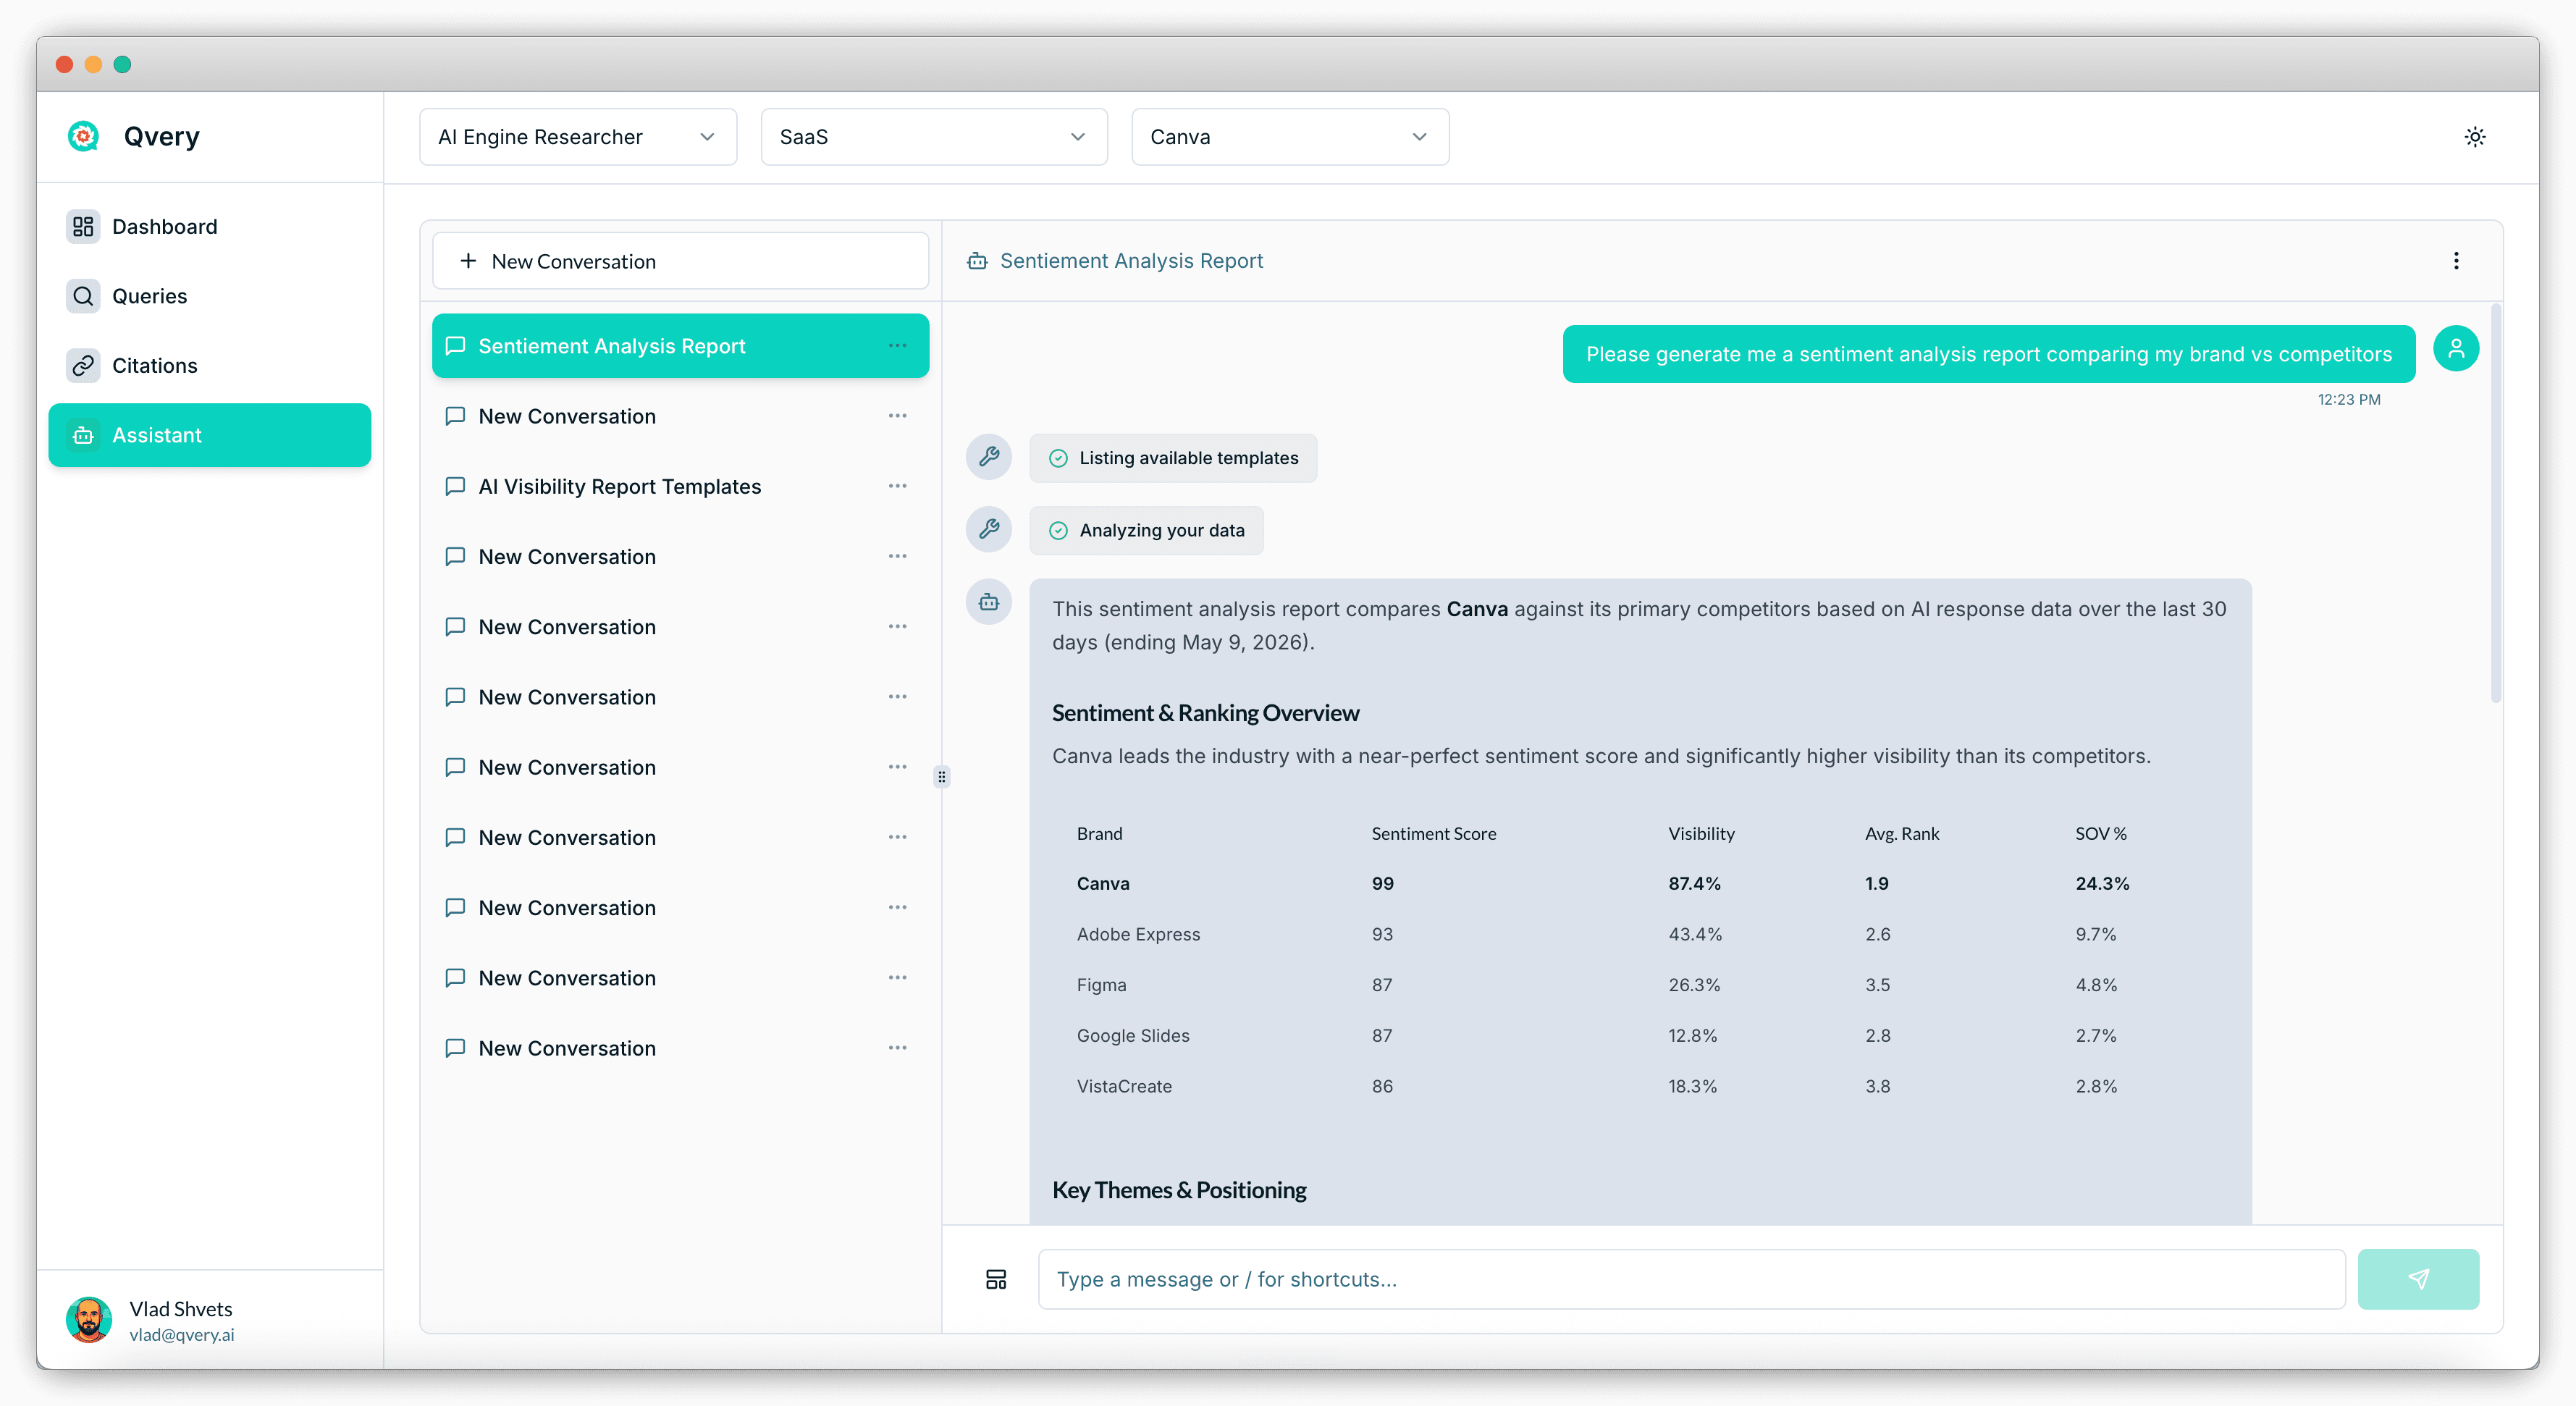
Canva leads on sentiment with a 99, a near-perfect score. The interesting data points sit lower in the table: Adobe Express at 93 with much weaker visibility, Figma and Google Slides clustered at 87, and VistaCreate at 86 despite minimal share of voice. Each one is a different competitive story. And every one of them is invisible from the dashboard alone.
The pattern: the more interesting the question, the less likely a dashboard will answer it. The Assistant is where you ask the questions a dashboard can't.
Prompt Examples For Better Reporting
These prompts work inside any Qvery account that has at least seven days of data collected. Paste them into Qvery Assistant and adjust the bracketed placeholders.
Prompt 1: Run The Standard Monthly Report
"Run the AI Visibility Report template for the past 30 days. After it generates, identify the three topics where my share of voice changed the most week-over-week, and tell me which competitors moved in the opposite direction on each topic."
Prompt 2: Build A Competitive Sentiment Report
"Generate a sentiment analysis report comparing [YOUR BRAND] versus my top five competitors over the past 30 days. For each brand, show sentiment score, visibility, average rank, and share of voice in a single table. Then identify which competitors have positive sentiment but lower visibility — those are the brands gaining momentum we should watch."
Prompt 3: Find The Citation Movement Underneath A Metric Change
"My share of voice dropped by [X] percentage points this week versus the previous week. Pull the queries where I lost the most ground, identify the citations the AI engines are now relying on for those queries, and tell me which of those citation URLs don't yet mention [YOUR BRAND]."
Prompt 4: Rewrite The Report As A Board Email
"Take the AI Visibility Report you just generated and rewrite it as a 200-word email to my board. Lead with the headline metric movement, explain what drove it in plain language, and end with the one strategic decision I'm asking the board to support. No charts, no tables — just prose."
The Bottom Line
Three metrics, not one. Visibility, share of voice, and average rank tell three different stories. Reports that lead with visibility alone hide the most important changes happening in your data.
Weekly is the floor, monthly is the rhythm. Daily reporting on AI engine visibility is a trap. Generative responses fluctuate even when nothing about your brand changes — wait a week before drawing a conclusion.
Level three questions earn the report's keep. Anyone can read a dashboard. The reporting work that moves the strategy is the cross-module, multi-step analysis only an AI agent can run.
Run the templates. Don't write reports. The AI Visibility Report, Monthly Visibility Report, and Weekly Digest Report cover the standard set. Saves hours every cycle.
Use free-form prompts for the rest. Sentiment, custom comparisons, drilling into a single metric movement — the Assistant handles the long tail of reporting questions templates can't anticipate.
If you found this useful, check out the other webinars at qvery.ai/webinars. And if you've got questions about how you're reporting on AI engine visibility, or if you've built a custom prompt inside Qvery Assistant that's working well for you, don't hesitate to email me at vlad@qvery.ai.
See you on the next one.
