By
Vlad Shvets
What Actually Answers "Best Realtor in [City]"
We ran agent-hiring questions on ChatGPT and Google AI Mode with a city named and without one. Naming the city does not hand the answer to the portals, and the city-named audit list is fourteen rows against forty.
We ran agent-hiring questions on ChatGPT and Google AI Mode with a city named and without one. Naming the city does not hand the answer to the portals, and the city-named audit list is fourteen rows against forty.
We ran agent-hiring questions on ChatGPT and Google AI Mode with a city named and without one. Naming the city does not hand the answer to the portals, and the city-named audit list is fourteen rows against forty.
Open ChatGPT and type the question a seller in your best market would type. Not your brand name. The question: best listing agent in Austin, top buyer agency in Charlotte, who should I list with in Boise.
Read what comes back, and then read the sources under it.
Those sources are the thing you can do something about, and if you run a brokerage in that city, you probably cannot say what they are. That is the gap most real estate marketing teams are sitting in. There is a national AI visibility number going around, and it is not much use in a meeting, because nobody sells houses nationally.
So we asked both versions of the question, with a city named and without one, and looked at which websites the answers cited.
The short version: when the question names a city, the list of websites you have to work is about fourteen rows. When it does not, the same coverage takes forty. The two lists are not the same list, and the shorter one belongs to the question your buyer types.
The Question Your Buyer Types Has Two Shapes
A vendor question in this category comes in two shapes.
The first names a place: best listing agent in Austin, which brokerage in Denver, top home-selling team in Nashville.
The second names a situation instead: best agency for a first-time seller, who to list with on an inherited property, which brokerage for a relocation.
If your tracking set is built only out of the second shape, you are watching a market nobody stands in. Your buyer is standing in a specific city. Write down the vendor questions your buyers ask in each metro you work, in their words, and mark each one: does it name the city, or not?
You need both lists in a minute, because they behave differently.
Your Working List Is Fourteen Rows, Not Forty
Start with the question that decides how much work you have: how many websites do you have to do something about?
Take the city-named questions and count the smallest set of domains that covers half of the answers that cited any source, then the set that covers four fifths. Do the same for the questions with no city in them.
City named: four domains cover half. Fourteen cover four fifths.
No city named: eleven cover half. Forty cover four fifths.
That comparison comes from a targeted set of agent-hiring questions we ran on ChatGPT and Google AI Mode in September 2026, and it is a direction rather than a census.
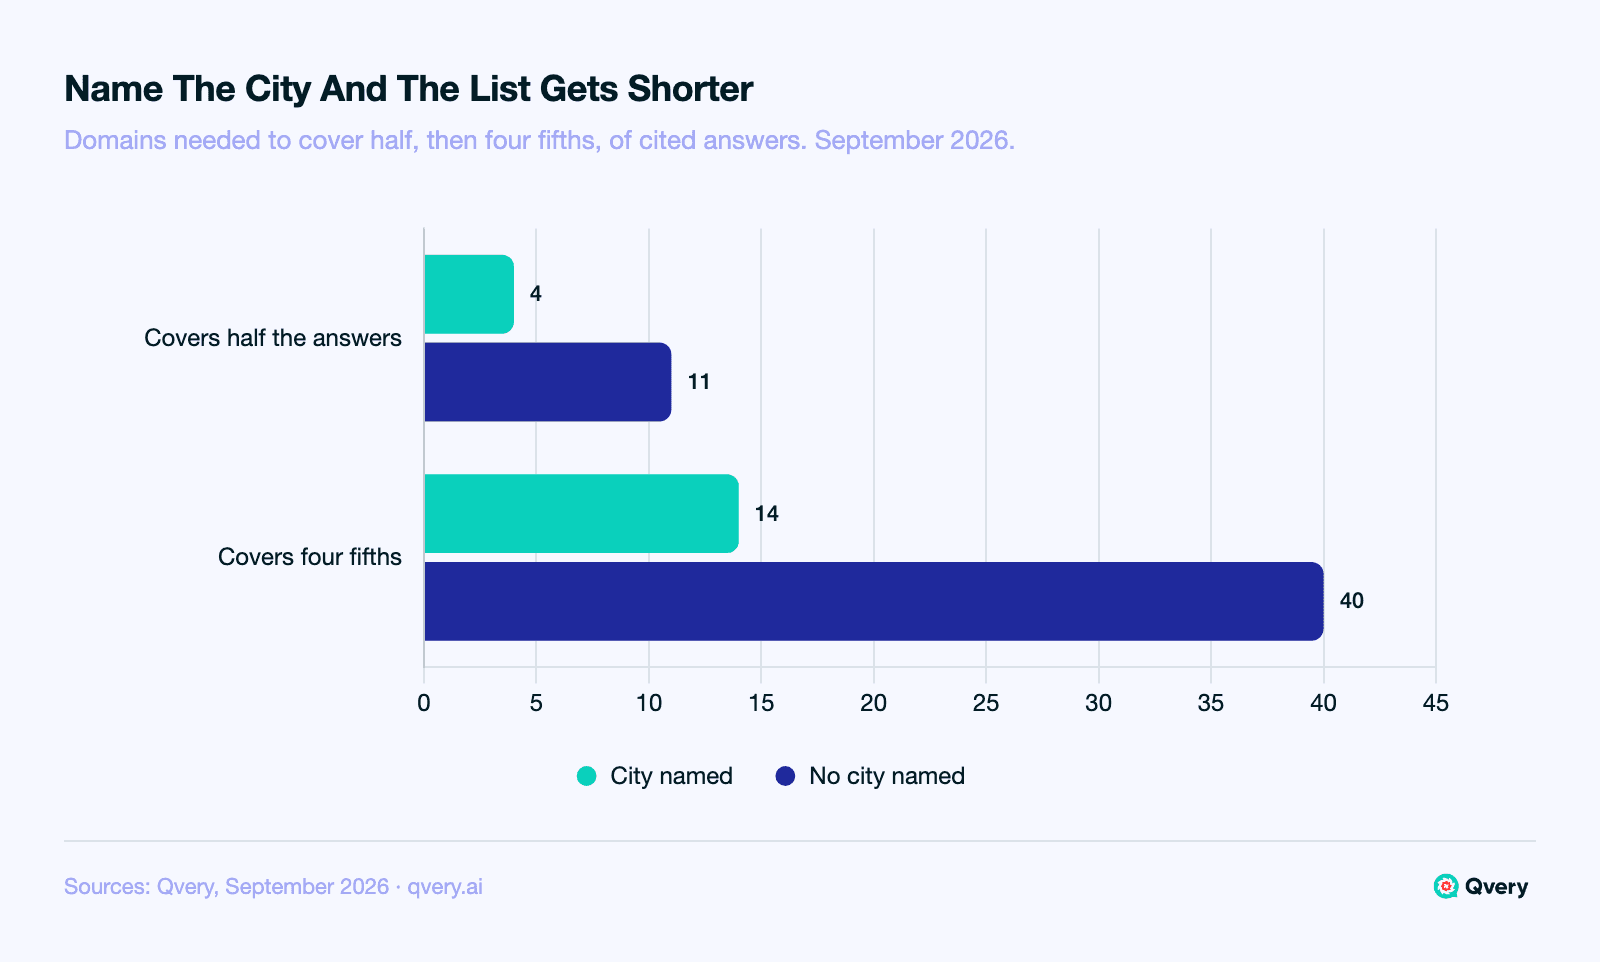
Fourteen rows is a list you can put owners and dates against. Forty is a project nobody finishes.
The shorter list belongs to the question your buyer types. The longer one belongs to a market nobody stands in.
Here is the city-named list in full, in the order the coverage was reached:
Zillow, Google, Realtor.com, US News real estate
RealTrends, The Moore Real Estate Group, MN Divorce Real Estate Expert, BiggerPockets
Compass, TAP Commercial Real Estate, KC Probate Pro, HomeLight
Caring Transitions Southern Nashville, Lovejoy Real Estate
Four of those rows also appear in the four-fifths list for the questions with no city: Zillow, Realtor.com, RealTrends and HomeLight. Four out of the smaller list's fourteen, a shared fraction of 0.29. Everything else diverges.
That is a shared core with a distinct tail, and it is the answer to the question this article exists for. One audit list, kept in two sections: the four rows that carry both question shapes, and the rest, which are specific to how the question was asked.
The Local Layer Is In There, and It Is the Biggest One
Look at the fourteen-row list again and notice what most of it is. The portals are there, but most of the rows are individual agents, small teams and local brokerages, on their own sites.
That holds when you classify every cited domain and count how often each kind of source appears. In the city-named questions, local and individual business sites were present in 64.1% of the answers that cited any source, against 36.75% for the national portals and 33.33% for editorial and industry sources.
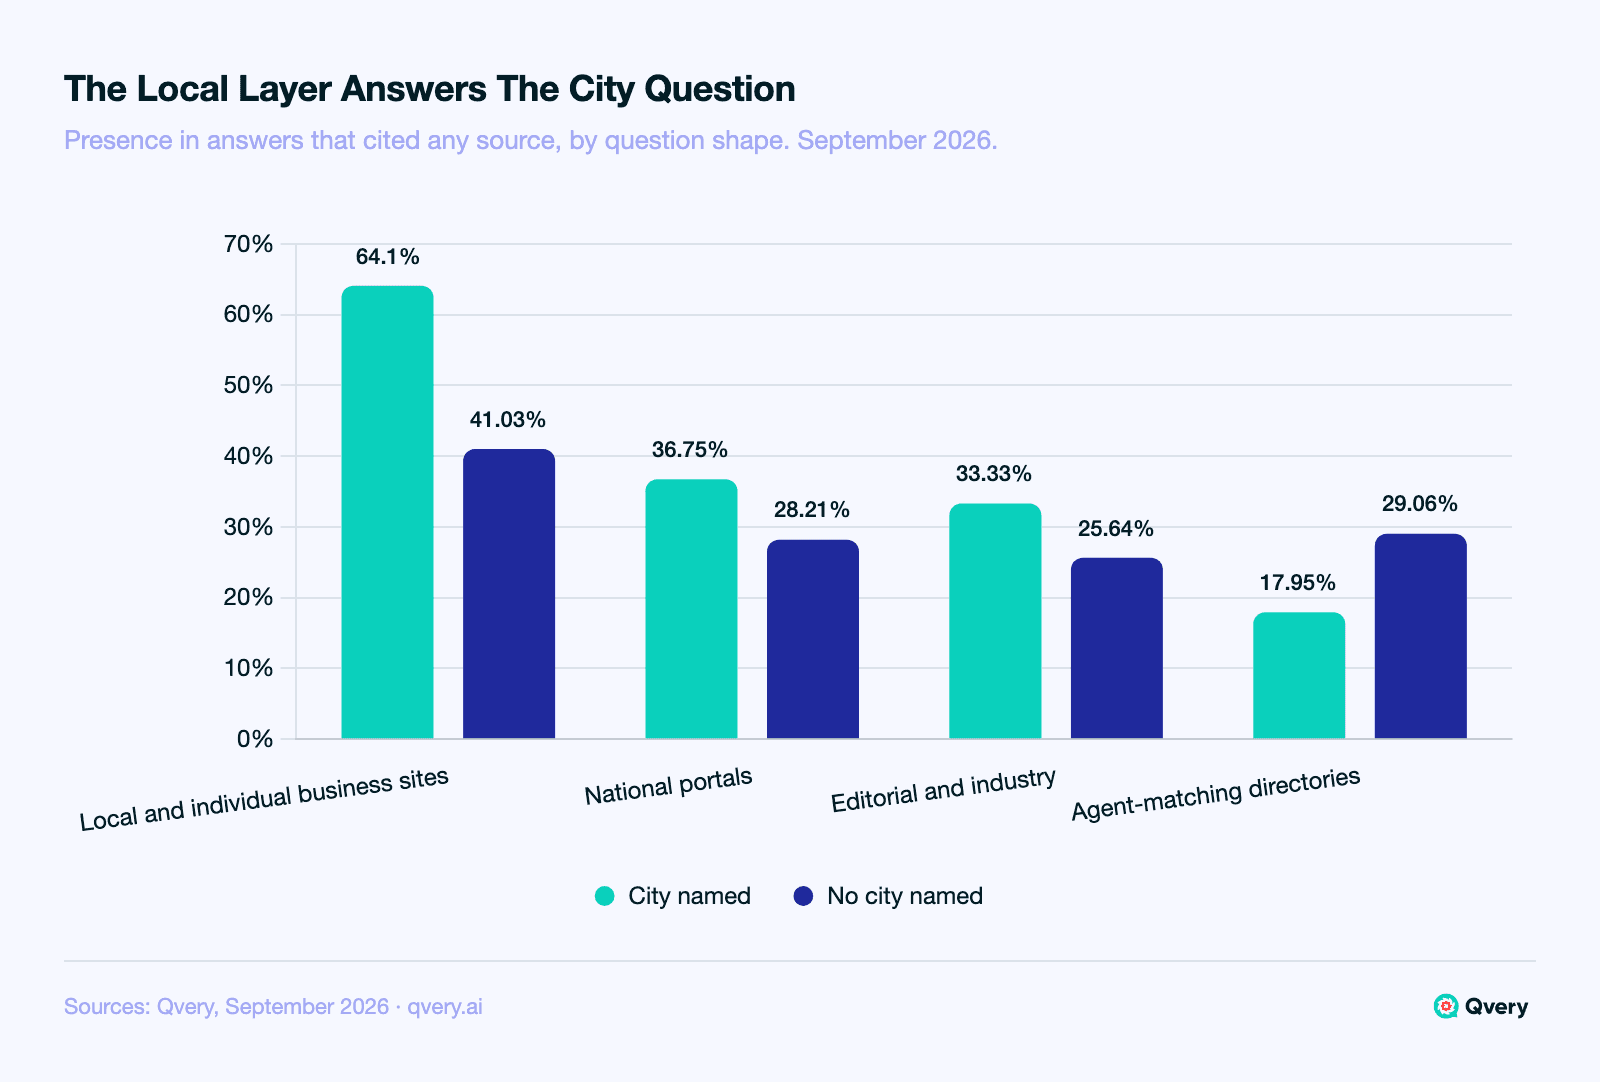
Zillow is one domain and it is a big one. The local layer is a category, and in city-named answers that category was present in more answers than the portal category was.
Without a city in the question, the local layer was present in 41.03% of the answers that cited any source. Public-sector and licensing sources went the other way, from 1.71% with a city named to 17.95% without one, and video from 1.71% to 10.26%.
One layer inverts, and it is the one brands are most often told to buy into. Agent-matching and referral directories were present in 29.06% of the answers that cited any source with no city named, and 17.95% of the city-named ones.
What I Would Do With That
Careful here about what the data says. We measured which domains the answers cited. We did not measure why an engine cites one local site over another, and nobody who tells you they have measured that is telling you the truth.
What I would do with the pattern, as judgment rather than a finding:
Check your own domain first. Run your metro's question and see whether you appear in the citations at all. Most brokerages have never looked.
Read the local sites that appear. They are your competitive set for that question, and they are not the portals.
The four shared rows are maintenance, not strategy. They carry both question shapes, so being absent is expensive and being present is not a differentiator.
Build the Measurement Before You Buy Anything
This is a setup recommendation, not a research result. It takes an afternoon.
One topic per metro. State-level and national topics blend the two question shapes back together, which is what produced the useless number in the first place.
Both question shapes inside each topic, in your buyer's words.
Both engines. ChatGPT and Google AI Mode are the two Qvery tracks, and a number that pools them is harder to read than two numbers that do not.
A window, decided in advance. A single run is a sample, not a reading. Decide how long you watch before you call anything a change.
Run the Metro Grid in Qvery
Set up one topic per metro and put both question shapes under it as queries. Qvery generates a starting set at onboarding and you edit it from there, in the Assistant, in plain language.
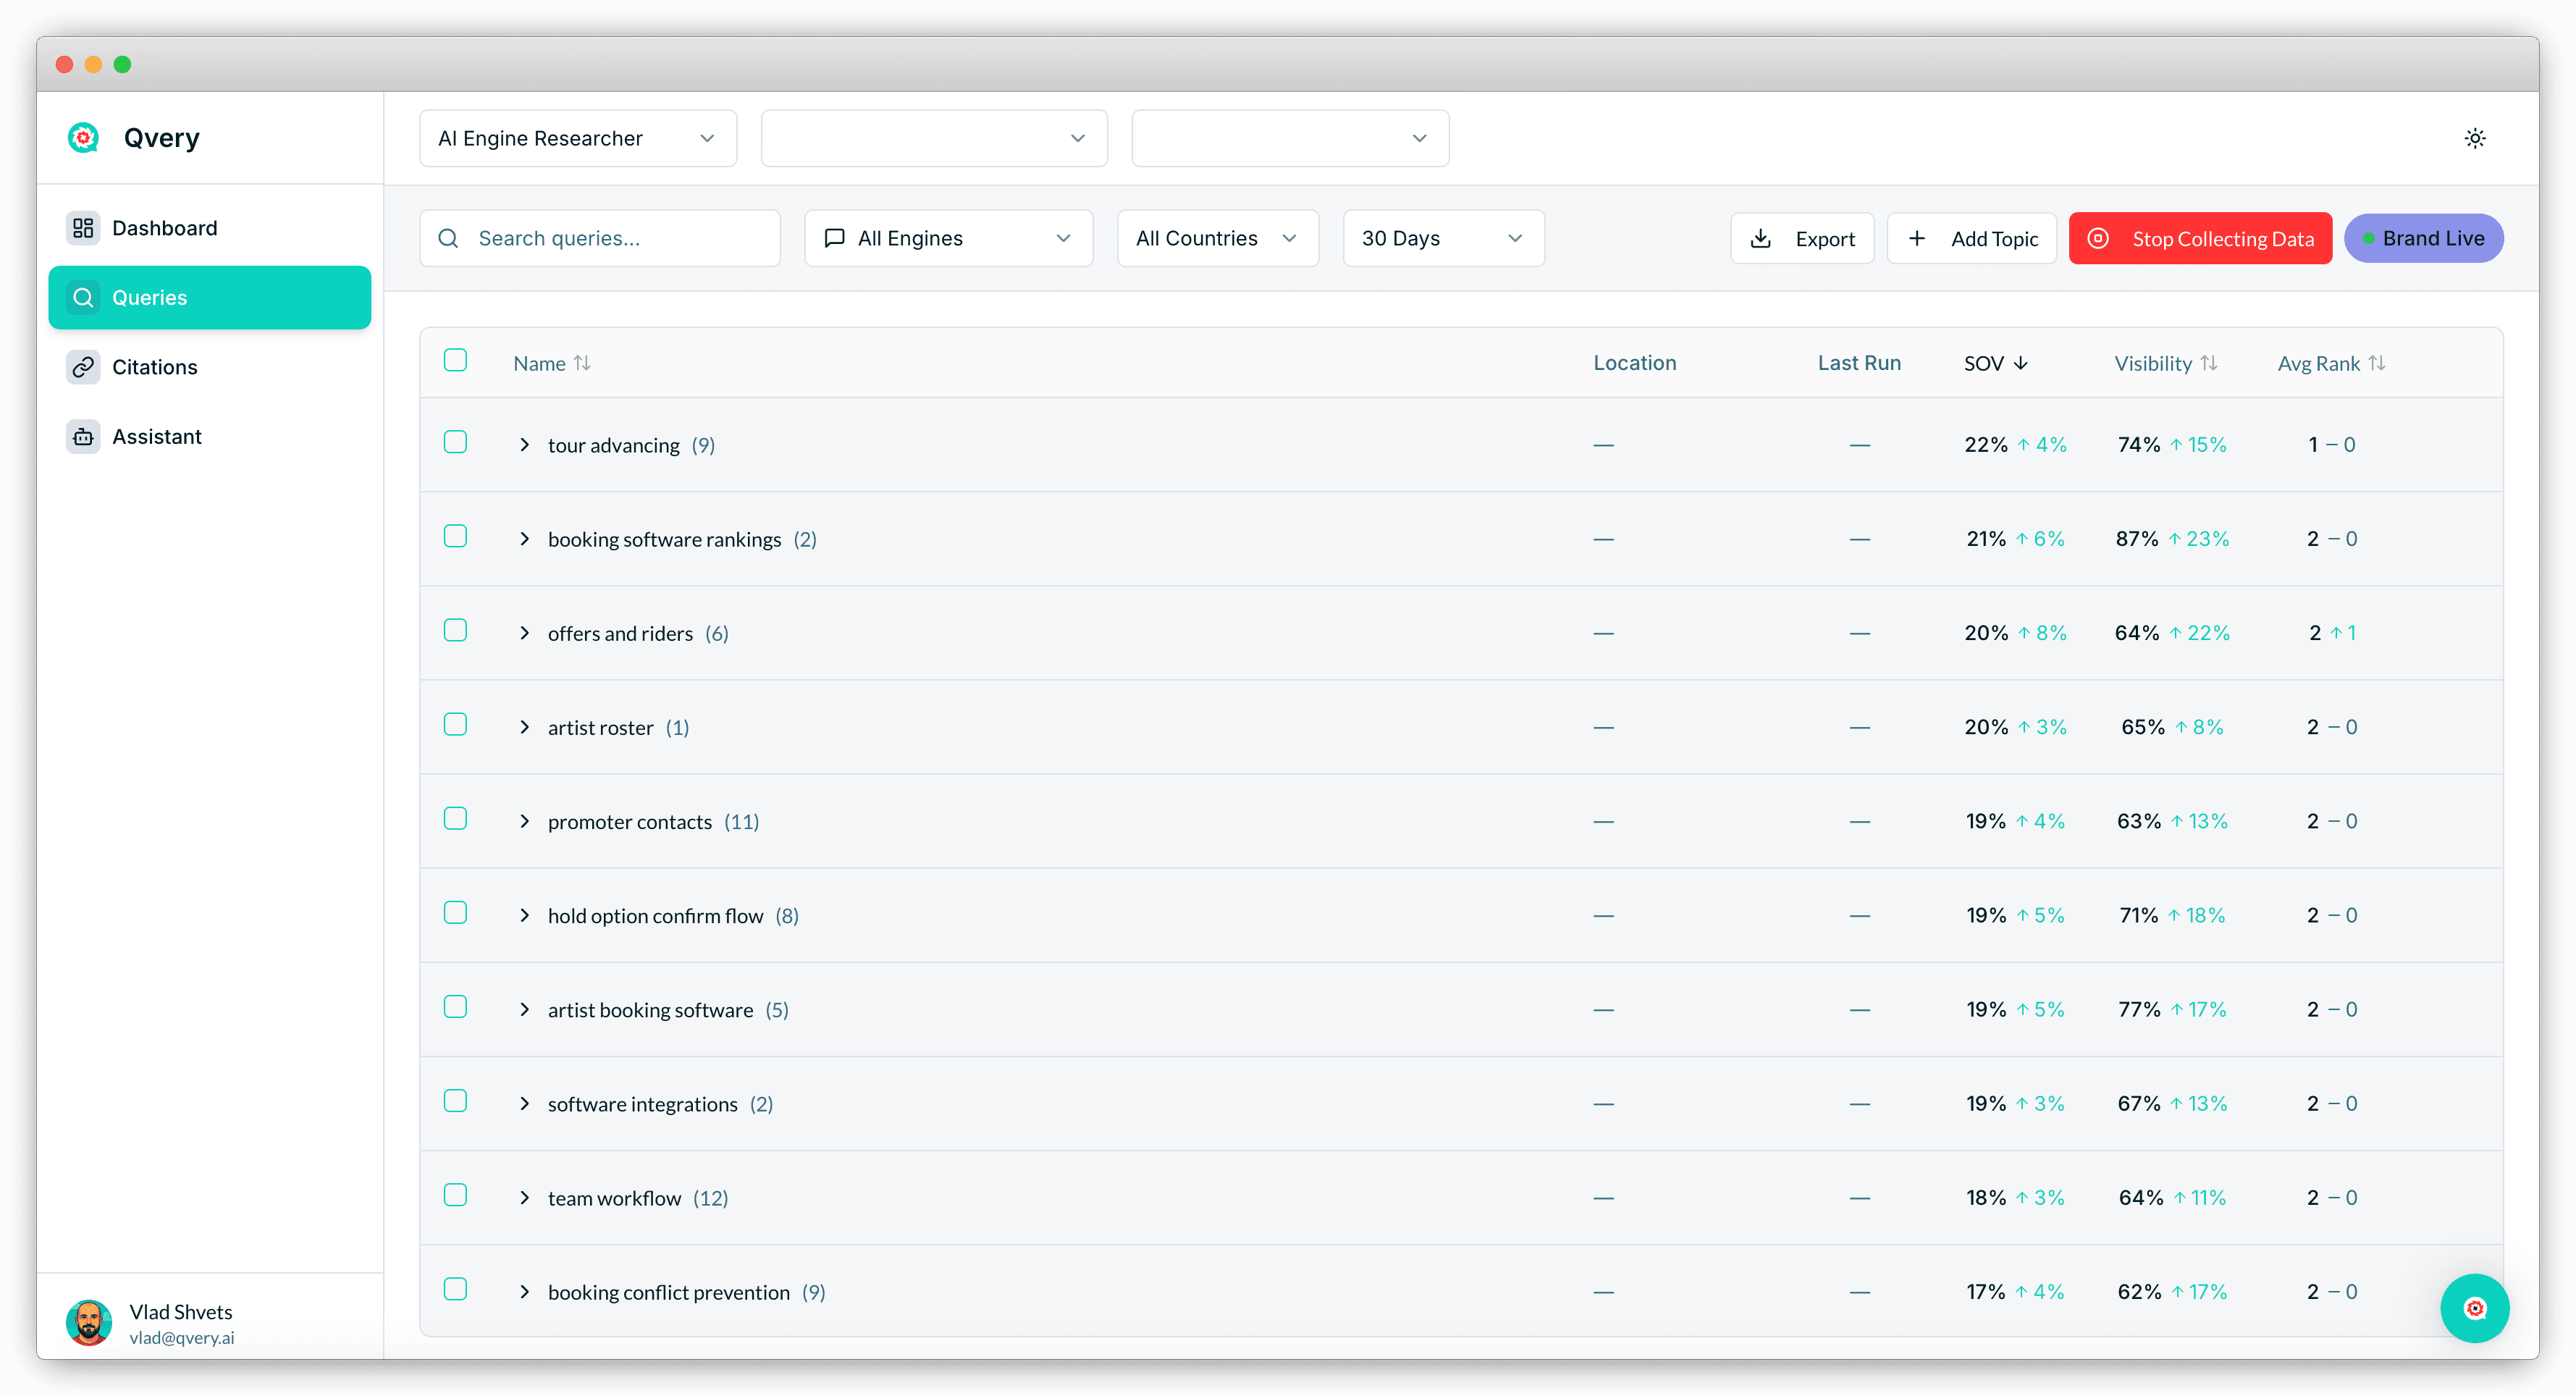
Once it runs you get three numbers daily per topic: whether you appear at all, how much of the conversation you own against the competitors you name, and where you land when you do appear.
If those three are not distinct in your head yet, we wrote them up separately in AI visibility versus share of voice.
The view that matters most here is the Citations view. Every answer Qvery collects keeps the sources cited in it, tied to the query and the engine that produced it, and the Citations view ranks the URLs and the domains behind them, each with a weight, filterable by engine and country. The ranking exports.
To turn that into the list this article is about:
Open one metro topic and read the Top Domains ranking in the Citations view.
Take rows from the top until another row stops changing what you would do. That is your working list.
Do the same for your no-city queries.
Mark every row present, absent or stale for your brokerage, and mark the rows on both lists.
A note on method. Our counts used a stricter definition than a top-ranked cut.
We took the smallest set of domains that together cover four fifths of the answers that cited any source, choosing them one at a time by how many still-uncovered answers each one adds. A ranked list read from the top is a close and usable version of the same thing.
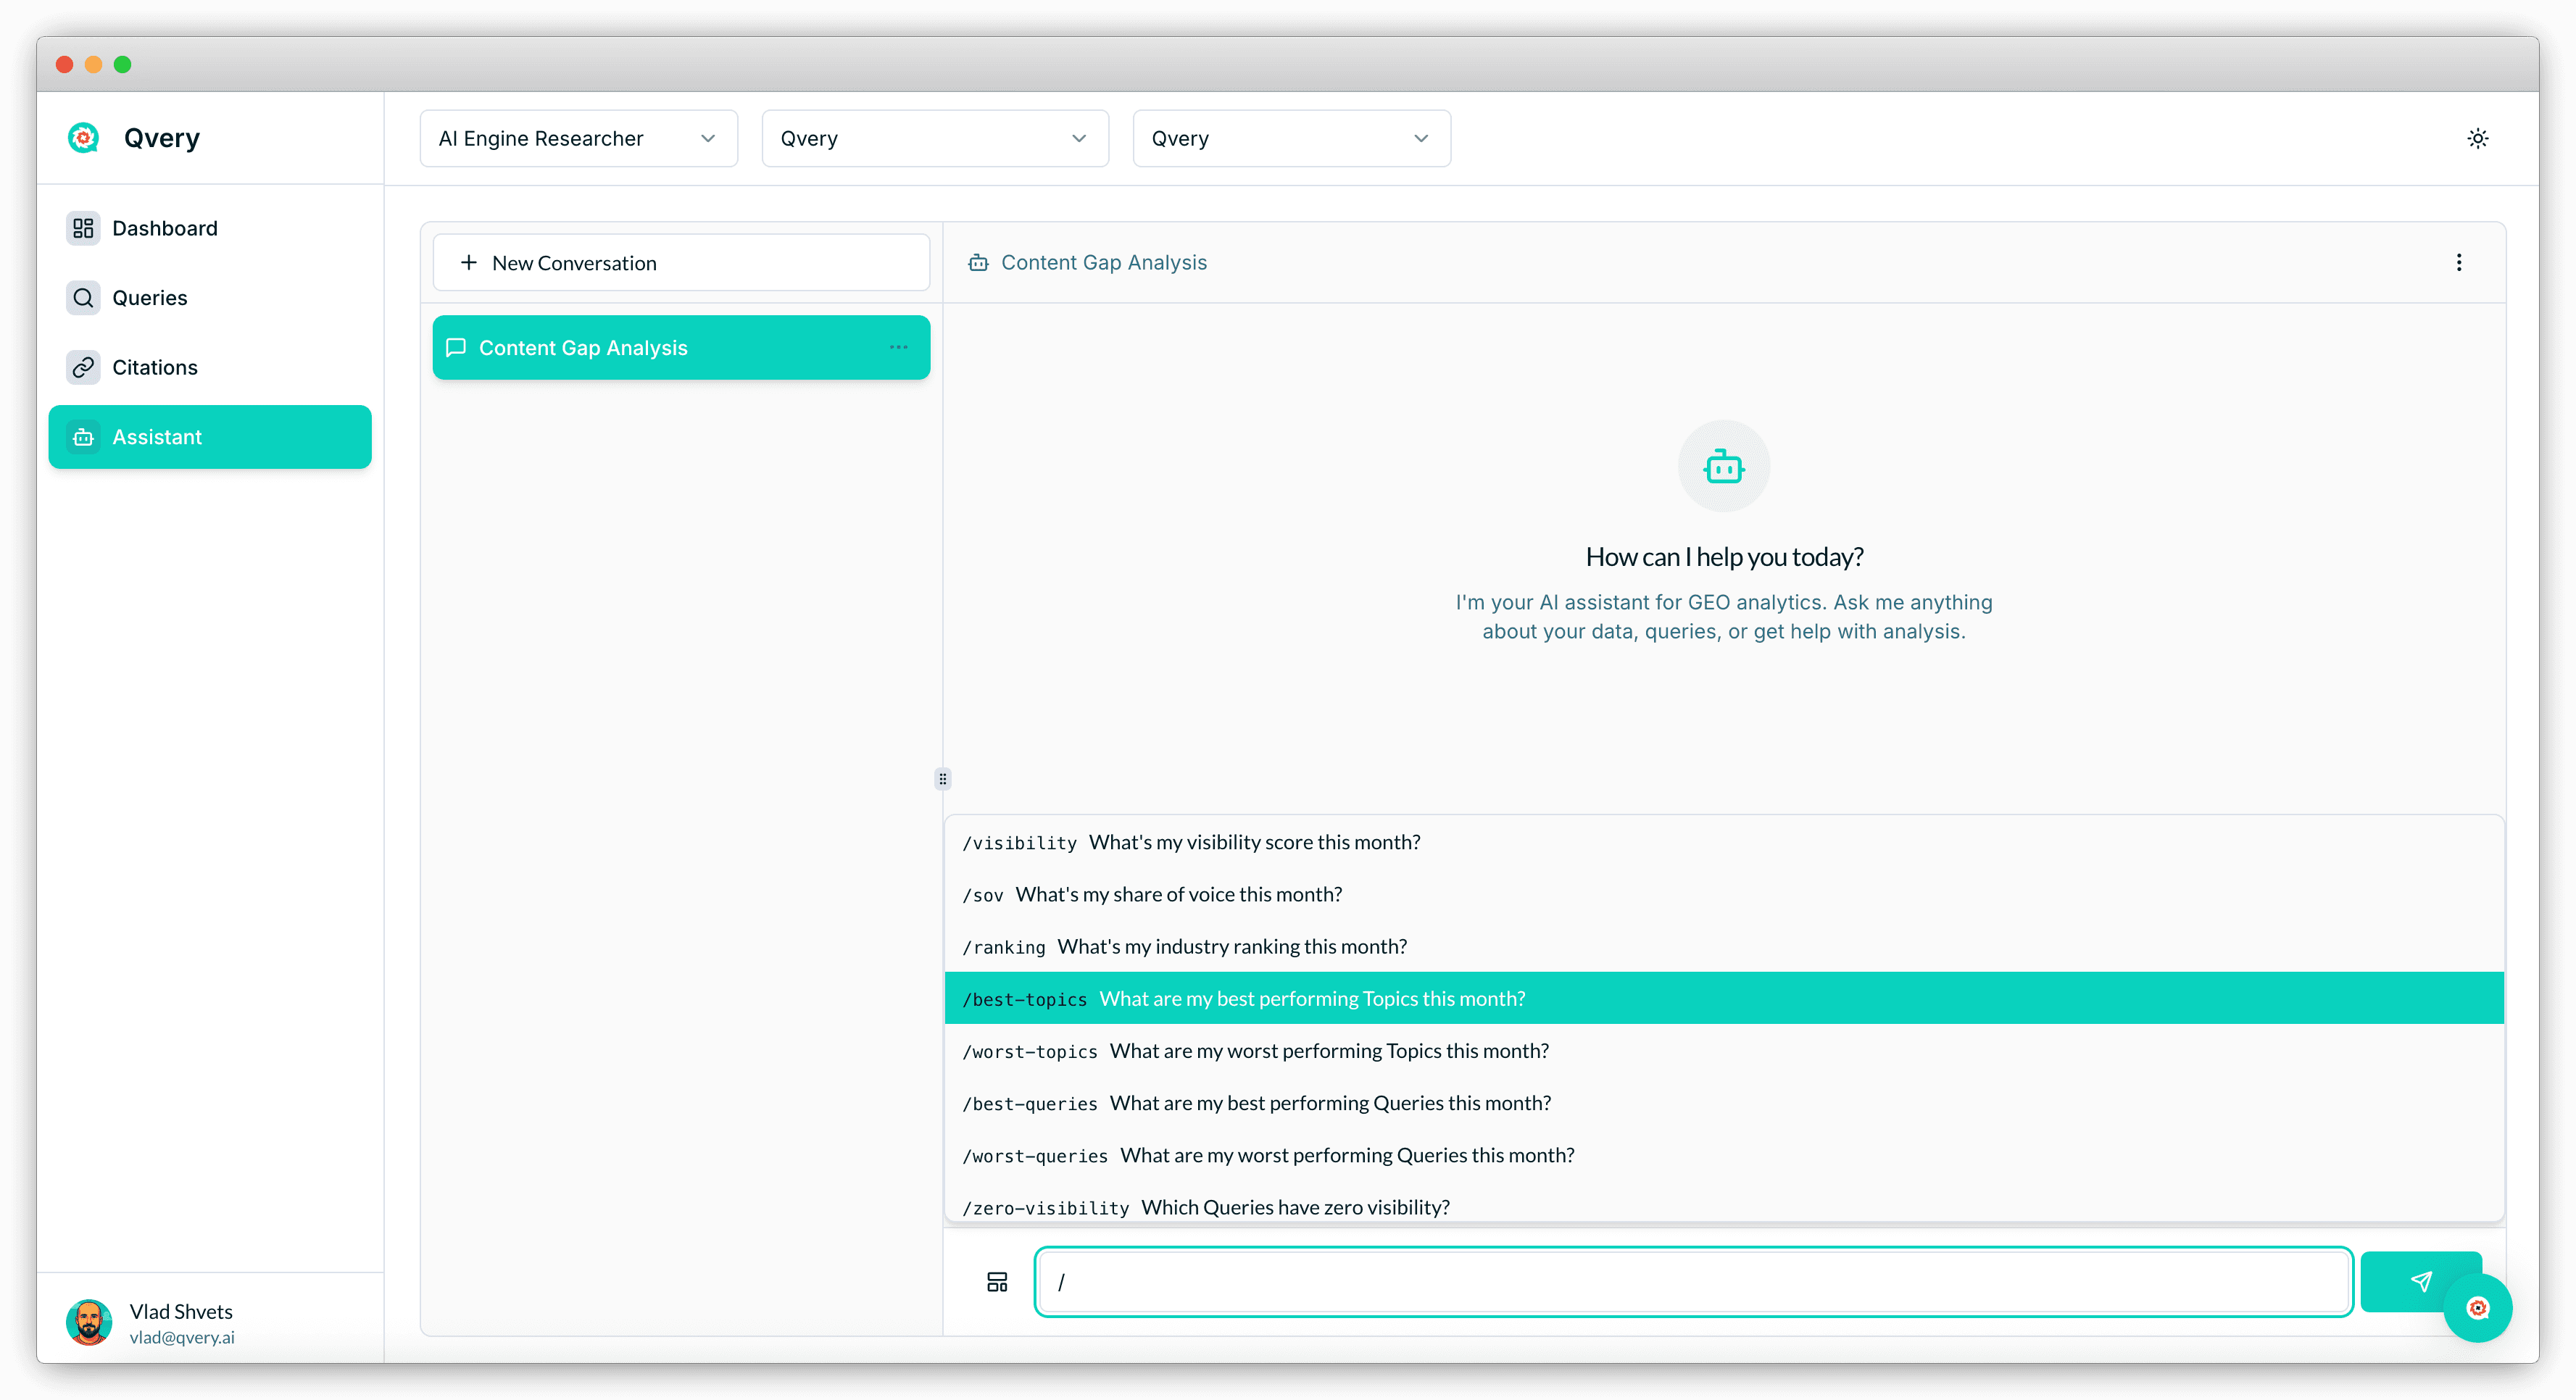
Then ask the Assistant which of your queries return zero visibility. That is the list worth acting on first, metro by metro.
Two things you should know going in. The Citations view records and ranks which sources an answer cited; it will not tell you which brands an answer named in its text, and it will not label a cited page as local or national. You do both reads yourself, once, when you build the list.
Start a Qvery trial and put your three biggest markets in as topics. It is free for seven days and there is no credit card to enter, which is time to get the metros configured and the first days of citations in.
Pick your best market. Run its question with the city in it, then without. If the two answers cite different domains, you have found the work.
Open ChatGPT and type the question a seller in your best market would type. Not your brand name. The question: best listing agent in Austin, top buyer agency in Charlotte, who should I list with in Boise.
Read what comes back, and then read the sources under it.
Those sources are the thing you can do something about, and if you run a brokerage in that city, you probably cannot say what they are. That is the gap most real estate marketing teams are sitting in. There is a national AI visibility number going around, and it is not much use in a meeting, because nobody sells houses nationally.
So we asked both versions of the question, with a city named and without one, and looked at which websites the answers cited.
The short version: when the question names a city, the list of websites you have to work is about fourteen rows. When it does not, the same coverage takes forty. The two lists are not the same list, and the shorter one belongs to the question your buyer types.
The Question Your Buyer Types Has Two Shapes
A vendor question in this category comes in two shapes.
The first names a place: best listing agent in Austin, which brokerage in Denver, top home-selling team in Nashville.
The second names a situation instead: best agency for a first-time seller, who to list with on an inherited property, which brokerage for a relocation.
If your tracking set is built only out of the second shape, you are watching a market nobody stands in. Your buyer is standing in a specific city. Write down the vendor questions your buyers ask in each metro you work, in their words, and mark each one: does it name the city, or not?
You need both lists in a minute, because they behave differently.
Your Working List Is Fourteen Rows, Not Forty
Start with the question that decides how much work you have: how many websites do you have to do something about?
Take the city-named questions and count the smallest set of domains that covers half of the answers that cited any source, then the set that covers four fifths. Do the same for the questions with no city in them.
City named: four domains cover half. Fourteen cover four fifths.
No city named: eleven cover half. Forty cover four fifths.
That comparison comes from a targeted set of agent-hiring questions we ran on ChatGPT and Google AI Mode in September 2026, and it is a direction rather than a census.
Fourteen rows is a list you can put owners and dates against. Forty is a project nobody finishes.
The shorter list belongs to the question your buyer types. The longer one belongs to a market nobody stands in.
Here is the city-named list in full, in the order the coverage was reached:
Zillow, Google, Realtor.com, US News real estate
RealTrends, The Moore Real Estate Group, MN Divorce Real Estate Expert, BiggerPockets
Compass, TAP Commercial Real Estate, KC Probate Pro, HomeLight
Caring Transitions Southern Nashville, Lovejoy Real Estate
Four of those rows also appear in the four-fifths list for the questions with no city: Zillow, Realtor.com, RealTrends and HomeLight. Four out of the smaller list's fourteen, a shared fraction of 0.29. Everything else diverges.
That is a shared core with a distinct tail, and it is the answer to the question this article exists for. One audit list, kept in two sections: the four rows that carry both question shapes, and the rest, which are specific to how the question was asked.
The Local Layer Is In There, and It Is the Biggest One
Look at the fourteen-row list again and notice what most of it is. The portals are there, but most of the rows are individual agents, small teams and local brokerages, on their own sites.
That holds when you classify every cited domain and count how often each kind of source appears. In the city-named questions, local and individual business sites were present in 64.1% of the answers that cited any source, against 36.75% for the national portals and 33.33% for editorial and industry sources.
Zillow is one domain and it is a big one. The local layer is a category, and in city-named answers that category was present in more answers than the portal category was.
Without a city in the question, the local layer was present in 41.03% of the answers that cited any source. Public-sector and licensing sources went the other way, from 1.71% with a city named to 17.95% without one, and video from 1.71% to 10.26%.
One layer inverts, and it is the one brands are most often told to buy into. Agent-matching and referral directories were present in 29.06% of the answers that cited any source with no city named, and 17.95% of the city-named ones.
What I Would Do With That
Careful here about what the data says. We measured which domains the answers cited. We did not measure why an engine cites one local site over another, and nobody who tells you they have measured that is telling you the truth.
What I would do with the pattern, as judgment rather than a finding:
Check your own domain first. Run your metro's question and see whether you appear in the citations at all. Most brokerages have never looked.
Read the local sites that appear. They are your competitive set for that question, and they are not the portals.
The four shared rows are maintenance, not strategy. They carry both question shapes, so being absent is expensive and being present is not a differentiator.
Build the Measurement Before You Buy Anything
This is a setup recommendation, not a research result. It takes an afternoon.
One topic per metro. State-level and national topics blend the two question shapes back together, which is what produced the useless number in the first place.
Both question shapes inside each topic, in your buyer's words.
Both engines. ChatGPT and Google AI Mode are the two Qvery tracks, and a number that pools them is harder to read than two numbers that do not.
A window, decided in advance. A single run is a sample, not a reading. Decide how long you watch before you call anything a change.
Run the Metro Grid in Qvery
Set up one topic per metro and put both question shapes under it as queries. Qvery generates a starting set at onboarding and you edit it from there, in the Assistant, in plain language.
Once it runs you get three numbers daily per topic: whether you appear at all, how much of the conversation you own against the competitors you name, and where you land when you do appear.
If those three are not distinct in your head yet, we wrote them up separately in AI visibility versus share of voice.
The view that matters most here is the Citations view. Every answer Qvery collects keeps the sources cited in it, tied to the query and the engine that produced it, and the Citations view ranks the URLs and the domains behind them, each with a weight, filterable by engine and country. The ranking exports.
To turn that into the list this article is about:
Open one metro topic and read the Top Domains ranking in the Citations view.
Take rows from the top until another row stops changing what you would do. That is your working list.
Do the same for your no-city queries.
Mark every row present, absent or stale for your brokerage, and mark the rows on both lists.
A note on method. Our counts used a stricter definition than a top-ranked cut.
We took the smallest set of domains that together cover four fifths of the answers that cited any source, choosing them one at a time by how many still-uncovered answers each one adds. A ranked list read from the top is a close and usable version of the same thing.
Then ask the Assistant which of your queries return zero visibility. That is the list worth acting on first, metro by metro.
Two things you should know going in. The Citations view records and ranks which sources an answer cited; it will not tell you which brands an answer named in its text, and it will not label a cited page as local or national. You do both reads yourself, once, when you build the list.
Start a Qvery trial and put your three biggest markets in as topics. It is free for seven days and there is no credit card to enter, which is time to get the metros configured and the first days of citations in.
Pick your best market. Run its question with the city in it, then without. If the two answers cite different domains, you have found the work.
Open ChatGPT and type the question a seller in your best market would type. Not your brand name. The question: best listing agent in Austin, top buyer agency in Charlotte, who should I list with in Boise.
Read what comes back, and then read the sources under it.
Those sources are the thing you can do something about, and if you run a brokerage in that city, you probably cannot say what they are. That is the gap most real estate marketing teams are sitting in. There is a national AI visibility number going around, and it is not much use in a meeting, because nobody sells houses nationally.
So we asked both versions of the question, with a city named and without one, and looked at which websites the answers cited.
The short version: when the question names a city, the list of websites you have to work is about fourteen rows. When it does not, the same coverage takes forty. The two lists are not the same list, and the shorter one belongs to the question your buyer types.
The Question Your Buyer Types Has Two Shapes
A vendor question in this category comes in two shapes.
The first names a place: best listing agent in Austin, which brokerage in Denver, top home-selling team in Nashville.
The second names a situation instead: best agency for a first-time seller, who to list with on an inherited property, which brokerage for a relocation.
If your tracking set is built only out of the second shape, you are watching a market nobody stands in. Your buyer is standing in a specific city. Write down the vendor questions your buyers ask in each metro you work, in their words, and mark each one: does it name the city, or not?
You need both lists in a minute, because they behave differently.
Your Working List Is Fourteen Rows, Not Forty
Start with the question that decides how much work you have: how many websites do you have to do something about?
Take the city-named questions and count the smallest set of domains that covers half of the answers that cited any source, then the set that covers four fifths. Do the same for the questions with no city in them.
City named: four domains cover half. Fourteen cover four fifths.
No city named: eleven cover half. Forty cover four fifths.
That comparison comes from a targeted set of agent-hiring questions we ran on ChatGPT and Google AI Mode in September 2026, and it is a direction rather than a census.
Fourteen rows is a list you can put owners and dates against. Forty is a project nobody finishes.
The shorter list belongs to the question your buyer types. The longer one belongs to a market nobody stands in.
Here is the city-named list in full, in the order the coverage was reached:
Zillow, Google, Realtor.com, US News real estate
RealTrends, The Moore Real Estate Group, MN Divorce Real Estate Expert, BiggerPockets
Compass, TAP Commercial Real Estate, KC Probate Pro, HomeLight
Caring Transitions Southern Nashville, Lovejoy Real Estate
Four of those rows also appear in the four-fifths list for the questions with no city: Zillow, Realtor.com, RealTrends and HomeLight. Four out of the smaller list's fourteen, a shared fraction of 0.29. Everything else diverges.
That is a shared core with a distinct tail, and it is the answer to the question this article exists for. One audit list, kept in two sections: the four rows that carry both question shapes, and the rest, which are specific to how the question was asked.
The Local Layer Is In There, and It Is the Biggest One
Look at the fourteen-row list again and notice what most of it is. The portals are there, but most of the rows are individual agents, small teams and local brokerages, on their own sites.
That holds when you classify every cited domain and count how often each kind of source appears. In the city-named questions, local and individual business sites were present in 64.1% of the answers that cited any source, against 36.75% for the national portals and 33.33% for editorial and industry sources.
Zillow is one domain and it is a big one. The local layer is a category, and in city-named answers that category was present in more answers than the portal category was.
Without a city in the question, the local layer was present in 41.03% of the answers that cited any source. Public-sector and licensing sources went the other way, from 1.71% with a city named to 17.95% without one, and video from 1.71% to 10.26%.
One layer inverts, and it is the one brands are most often told to buy into. Agent-matching and referral directories were present in 29.06% of the answers that cited any source with no city named, and 17.95% of the city-named ones.
What I Would Do With That
Careful here about what the data says. We measured which domains the answers cited. We did not measure why an engine cites one local site over another, and nobody who tells you they have measured that is telling you the truth.
What I would do with the pattern, as judgment rather than a finding:
Check your own domain first. Run your metro's question and see whether you appear in the citations at all. Most brokerages have never looked.
Read the local sites that appear. They are your competitive set for that question, and they are not the portals.
The four shared rows are maintenance, not strategy. They carry both question shapes, so being absent is expensive and being present is not a differentiator.
Build the Measurement Before You Buy Anything
This is a setup recommendation, not a research result. It takes an afternoon.
One topic per metro. State-level and national topics blend the two question shapes back together, which is what produced the useless number in the first place.
Both question shapes inside each topic, in your buyer's words.
Both engines. ChatGPT and Google AI Mode are the two Qvery tracks, and a number that pools them is harder to read than two numbers that do not.
A window, decided in advance. A single run is a sample, not a reading. Decide how long you watch before you call anything a change.
Run the Metro Grid in Qvery
Set up one topic per metro and put both question shapes under it as queries. Qvery generates a starting set at onboarding and you edit it from there, in the Assistant, in plain language.
Once it runs you get three numbers daily per topic: whether you appear at all, how much of the conversation you own against the competitors you name, and where you land when you do appear.
If those three are not distinct in your head yet, we wrote them up separately in AI visibility versus share of voice.
The view that matters most here is the Citations view. Every answer Qvery collects keeps the sources cited in it, tied to the query and the engine that produced it, and the Citations view ranks the URLs and the domains behind them, each with a weight, filterable by engine and country. The ranking exports.
To turn that into the list this article is about:
Open one metro topic and read the Top Domains ranking in the Citations view.
Take rows from the top until another row stops changing what you would do. That is your working list.
Do the same for your no-city queries.
Mark every row present, absent or stale for your brokerage, and mark the rows on both lists.
A note on method. Our counts used a stricter definition than a top-ranked cut.
We took the smallest set of domains that together cover four fifths of the answers that cited any source, choosing them one at a time by how many still-uncovered answers each one adds. A ranked list read from the top is a close and usable version of the same thing.
Then ask the Assistant which of your queries return zero visibility. That is the list worth acting on first, metro by metro.
Two things you should know going in. The Citations view records and ranks which sources an answer cited; it will not tell you which brands an answer named in its text, and it will not label a cited page as local or national. You do both reads yourself, once, when you build the list.
Start a Qvery trial and put your three biggest markets in as topics. It is free for seven days and there is no credit card to enter, which is time to get the metros configured and the first days of citations in.
Pick your best market. Run its question with the city in it, then without. If the two answers cite different domains, you have found the work.
Open ChatGPT and type the question a seller in your best market would type. Not your brand name. The question: best listing agent in Austin, top buyer agency in Charlotte, who should I list with in Boise.
Read what comes back, and then read the sources under it.
Those sources are the thing you can do something about, and if you run a brokerage in that city, you probably cannot say what they are. That is the gap most real estate marketing teams are sitting in. There is a national AI visibility number going around, and it is not much use in a meeting, because nobody sells houses nationally.
So we asked both versions of the question, with a city named and without one, and looked at which websites the answers cited.
The short version: when the question names a city, the list of websites you have to work is about fourteen rows. When it does not, the same coverage takes forty. The two lists are not the same list, and the shorter one belongs to the question your buyer types.
The Question Your Buyer Types Has Two Shapes
A vendor question in this category comes in two shapes.
The first names a place: best listing agent in Austin, which brokerage in Denver, top home-selling team in Nashville.
The second names a situation instead: best agency for a first-time seller, who to list with on an inherited property, which brokerage for a relocation.
If your tracking set is built only out of the second shape, you are watching a market nobody stands in. Your buyer is standing in a specific city. Write down the vendor questions your buyers ask in each metro you work, in their words, and mark each one: does it name the city, or not?
You need both lists in a minute, because they behave differently.
Your Working List Is Fourteen Rows, Not Forty
Start with the question that decides how much work you have: how many websites do you have to do something about?
Take the city-named questions and count the smallest set of domains that covers half of the answers that cited any source, then the set that covers four fifths. Do the same for the questions with no city in them.
City named: four domains cover half. Fourteen cover four fifths.
No city named: eleven cover half. Forty cover four fifths.
That comparison comes from a targeted set of agent-hiring questions we ran on ChatGPT and Google AI Mode in September 2026, and it is a direction rather than a census.
Fourteen rows is a list you can put owners and dates against. Forty is a project nobody finishes.
The shorter list belongs to the question your buyer types. The longer one belongs to a market nobody stands in.
Here is the city-named list in full, in the order the coverage was reached:
Zillow, Google, Realtor.com, US News real estate
RealTrends, The Moore Real Estate Group, MN Divorce Real Estate Expert, BiggerPockets
Compass, TAP Commercial Real Estate, KC Probate Pro, HomeLight
Caring Transitions Southern Nashville, Lovejoy Real Estate
Four of those rows also appear in the four-fifths list for the questions with no city: Zillow, Realtor.com, RealTrends and HomeLight. Four out of the smaller list's fourteen, a shared fraction of 0.29. Everything else diverges.
That is a shared core with a distinct tail, and it is the answer to the question this article exists for. One audit list, kept in two sections: the four rows that carry both question shapes, and the rest, which are specific to how the question was asked.
The Local Layer Is In There, and It Is the Biggest One
Look at the fourteen-row list again and notice what most of it is. The portals are there, but most of the rows are individual agents, small teams and local brokerages, on their own sites.
That holds when you classify every cited domain and count how often each kind of source appears. In the city-named questions, local and individual business sites were present in 64.1% of the answers that cited any source, against 36.75% for the national portals and 33.33% for editorial and industry sources.
Zillow is one domain and it is a big one. The local layer is a category, and in city-named answers that category was present in more answers than the portal category was.
Without a city in the question, the local layer was present in 41.03% of the answers that cited any source. Public-sector and licensing sources went the other way, from 1.71% with a city named to 17.95% without one, and video from 1.71% to 10.26%.
One layer inverts, and it is the one brands are most often told to buy into. Agent-matching and referral directories were present in 29.06% of the answers that cited any source with no city named, and 17.95% of the city-named ones.
What I Would Do With That
Careful here about what the data says. We measured which domains the answers cited. We did not measure why an engine cites one local site over another, and nobody who tells you they have measured that is telling you the truth.
What I would do with the pattern, as judgment rather than a finding:
Check your own domain first. Run your metro's question and see whether you appear in the citations at all. Most brokerages have never looked.
Read the local sites that appear. They are your competitive set for that question, and they are not the portals.
The four shared rows are maintenance, not strategy. They carry both question shapes, so being absent is expensive and being present is not a differentiator.
Build the Measurement Before You Buy Anything
This is a setup recommendation, not a research result. It takes an afternoon.
One topic per metro. State-level and national topics blend the two question shapes back together, which is what produced the useless number in the first place.
Both question shapes inside each topic, in your buyer's words.
Both engines. ChatGPT and Google AI Mode are the two Qvery tracks, and a number that pools them is harder to read than two numbers that do not.
A window, decided in advance. A single run is a sample, not a reading. Decide how long you watch before you call anything a change.
Run the Metro Grid in Qvery
Set up one topic per metro and put both question shapes under it as queries. Qvery generates a starting set at onboarding and you edit it from there, in the Assistant, in plain language.
Once it runs you get three numbers daily per topic: whether you appear at all, how much of the conversation you own against the competitors you name, and where you land when you do appear.
If those three are not distinct in your head yet, we wrote them up separately in AI visibility versus share of voice.
The view that matters most here is the Citations view. Every answer Qvery collects keeps the sources cited in it, tied to the query and the engine that produced it, and the Citations view ranks the URLs and the domains behind them, each with a weight, filterable by engine and country. The ranking exports.
To turn that into the list this article is about:
Open one metro topic and read the Top Domains ranking in the Citations view.
Take rows from the top until another row stops changing what you would do. That is your working list.
Do the same for your no-city queries.
Mark every row present, absent or stale for your brokerage, and mark the rows on both lists.
A note on method. Our counts used a stricter definition than a top-ranked cut.
We took the smallest set of domains that together cover four fifths of the answers that cited any source, choosing them one at a time by how many still-uncovered answers each one adds. A ranked list read from the top is a close and usable version of the same thing.
Then ask the Assistant which of your queries return zero visibility. That is the list worth acting on first, metro by metro.
Two things you should know going in. The Citations view records and ranks which sources an answer cited; it will not tell you which brands an answer named in its text, and it will not label a cited page as local or national. You do both reads yourself, once, when you build the list.
Start a Qvery trial and put your three biggest markets in as topics. It is free for seven days and there is no credit card to enter, which is time to get the metros configured and the first days of citations in.
Pick your best market. Run its question with the city in it, then without. If the two answers cite different domains, you have found the work.

© 2026 Qvery AI OÜ