By
Vlad Shvets
How A Fintech Company Can Measure AI Visibility Of Its Products
A consumer fintech line is two questions, money in and money out. One publisher layer answers both, the domains underneath do not, and that decides whether you need one tracking set or two.
A consumer fintech line is two questions, money in and money out. One publisher layer answers both, the domains underneath do not, and that decides whether you need one tracking set or two.
A consumer fintech line is two questions, money in and money out. One publisher layer answers both, the domains underneath do not, and that decides whether you need one tracking set or two.
Somebody forwards you an article about AI search. You are asked, in a meeting, what the company should do about it. You cannot say yet, because nobody has decided what to measure or what would count as a change.
That decision is smaller than it looks, and it is the one worth making first.
A consumer fintech line splits into two questions. Where a person is told to put money, and where they are told to get it. Track them as one blended set and you get a number that describes neither.
Track them separately and the first thing you learn is how much of the answer surface the two halves share. That is what decides whether you need one tracking set or two.
This is about the setup, not about a leaderboard. Nothing here says who wins.
Split Your Line By Money Direction First
Write out the questions your customers ask before they know your name. Then sort them into two piles.
Money in: where to open a savings account, which app to invest with, best high-yield account for an emergency fund, where to park cash for six months.
Money out: which card to get with fair credit, best buy-now-pay-later option, where to borrow for a renovation, which lender for a first car.
Plenty of fintech companies sell across that line. A neobank with a savings product and a card sits on both sides.
If your tracked query set is one undifferentiated bag labelled with your category, you are averaging two markets that behave differently. The average then belongs to whichever half you happened to write more queries for.
Keep both piles. Everything below reads off them.
Count The Rows Each Half Needs
The useful first measurement is not a share of voice. It is a count: how many websites do you have to care about at all?
Take one pile and find the smallest set of domains that covers half of the answers that cited any source, then the set that covers four fifths. Do it again for the other pile. Compare the two sets.
Across a targeted set of consumer fintech questions we ran on ChatGPT and Google AI Mode in September 2026, here is how that came out. It is a direction, not a census.
Money in: four domains cover half of the answers that cited any source. Nine cover four fifths.
Money out: four cover half. Ten cover four fifths.
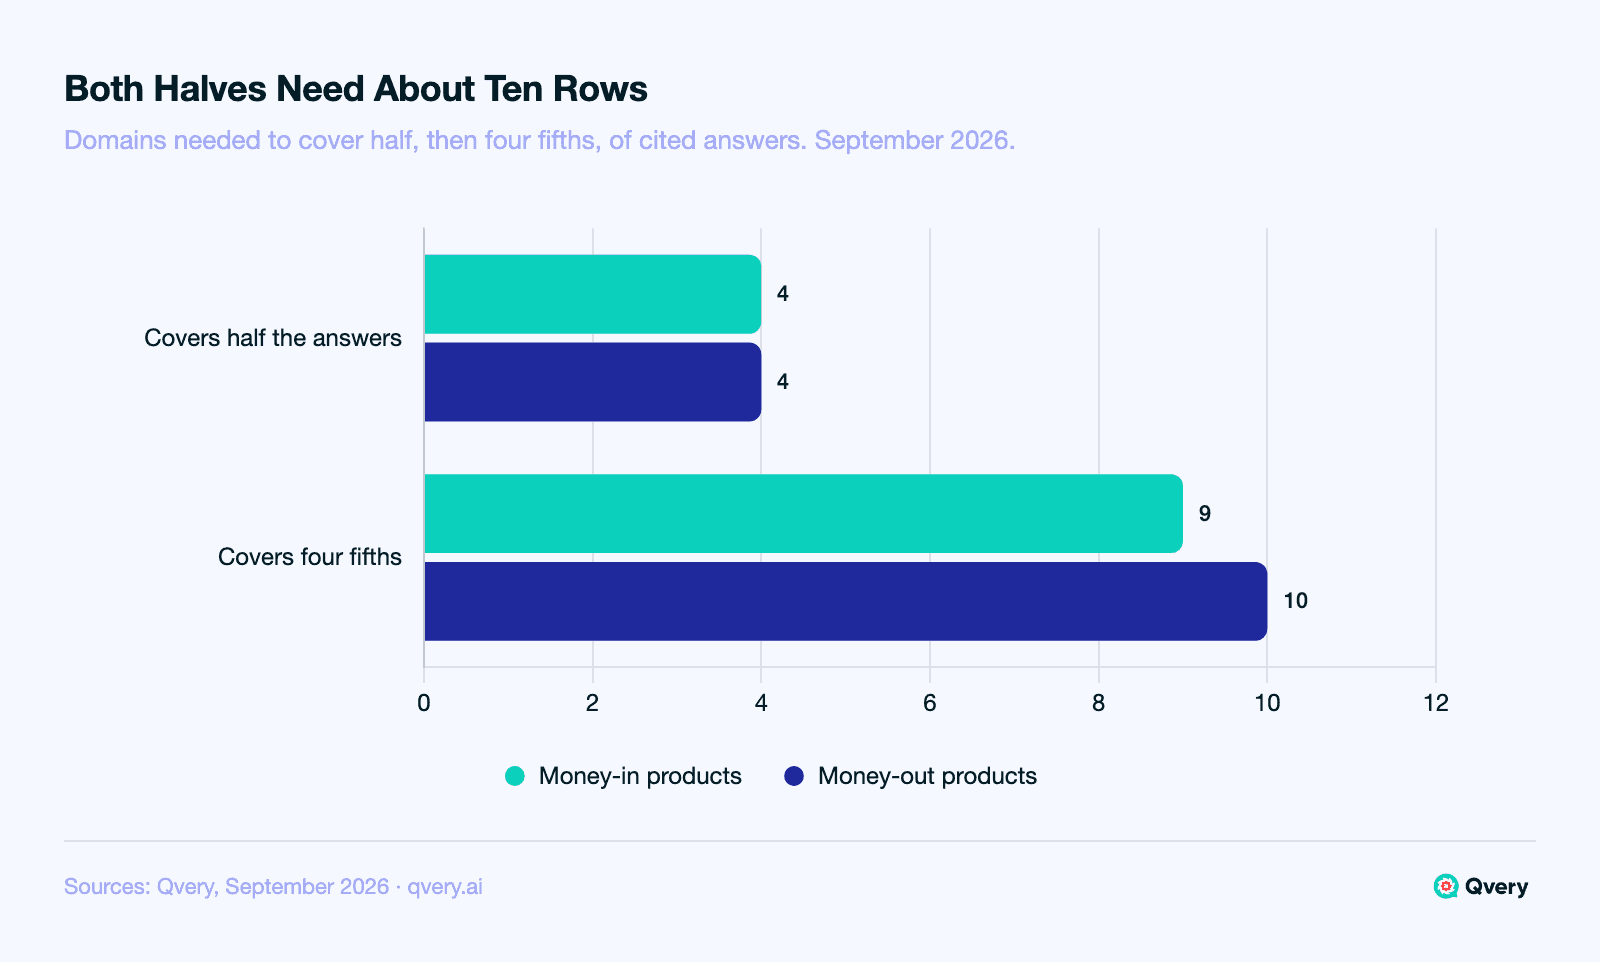
Both working lists are short.
Nine and ten rows is a spreadsheet with owners and dates against it, not a programme. Worth knowing before anyone proposes a content plan.
The more useful number is the overlap. Three rows sit on both lists: NerdWallet, MoneySavingExpert and YouTube. The rest do not.
The money-in list carries Fidelity, the Wall Street Journal, Wealthsimple, the IRS, Canstar and Bankrate, while the money-out list carries Forbes, Ratehub, MoneyHelper, Experian, Afterpay, Discover and Scotiabank, which makes three shared rows out of a nine-row list a shared core with a tail on each side that belongs to one half only.
Treat the three shared rows as maintenance. They sit on both lists, so they are the rows to keep an eye on rather than the rows that separate you from anyone.
The Publisher Layer Answers Both Halves
Classify every cited domain by what kind of site it is and the shared core takes on a shape you can act on.
Personal-finance review hubs were present in 73.17% of answers that cited any source on the money-in side and 73.39% on the money-out side. Two figures that close at three significant figures is the finding here.
Whichever half of the line a buyer asks about, the same publisher layer is present in about the same share of the answers that cited anything at all. It is the one layer a fintech has to earn regardless of which products it sells this year.
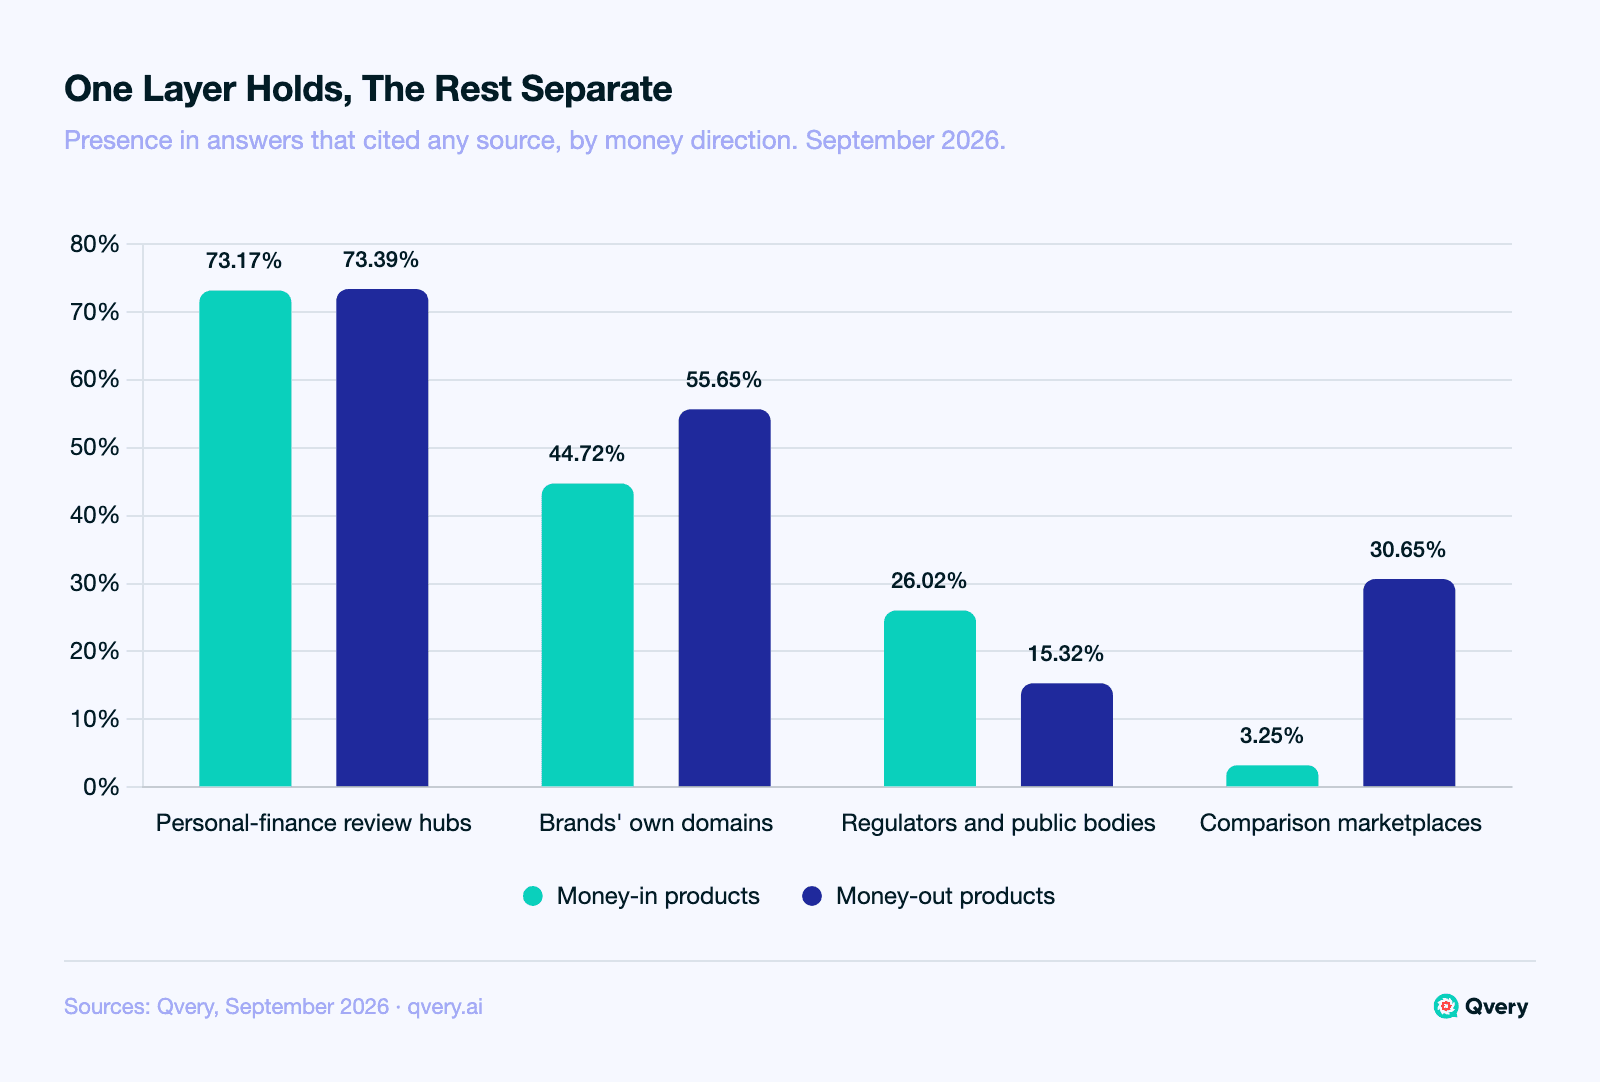
Below that layer the two halves come apart. Comparison marketplaces and credit-score services were present in 30.65% of answers that cited any source on the money-out side and 3.25% on the money-in side.
Regulators and public bodies ran the other way, present in 26.02% of answers that cited any source on the money-in side and 15.32% on the money-out side. Video was present in 13.82% of answers that cited any source on the money-in side and 8.06% on the money-out side.
The layer that answers both halves is the one you have to earn. The layers that separate are the ones that tell you which half of your line a piece of work belongs to.
Careful about what that does and does not say. We counted which domains the answers cited. We did not measure why one review hub was cited and another was not, and a source being present in an answer is not the same as that source deciding the answer.
Check Where Your Own Domain Sits
Brands' own domains were present in 44.72% of answers that cited any source on the money-in side and 55.65% on the money-out side.
The gap looks like a difference and this study does not treat it as one. The ratio sits inside the band we set in advance for calling two figures equivalent, so we publish it as equivalent.
Those figures cover every brand's estate in the set, not yours specifically, which makes checking yours the cheapest item on the list. Run one question from each pile and look for your own domain in the citations.
If it is not there, go and look at the page before you conclude anything. Cheaper to investigate than a publisher you have to persuade.
Write The Query Set Before You Buy Anything
Judgment now, not findings. What a first pass should look like:
One topic per product line, filed under its direction. Products change names, the direction does not.
Your customers' words, including the constraint they mention out loud. Fair credit, first job, no fee, moving countries. Those constraints are how the questions get typed.
Your licensed countries, and only those. A blended global number averages markets you sell in with markets you do not.
Both engines separately. ChatGPT and Google AI Mode are the two Qvery tracks, and two numbers you can read beat one number that pools them.
A decided window and a decided threshold. One run is a sample. Write down how many days you will watch, and how far a number has to move before you treat it as a move rather than noise.
For what the three tracking numbers mean and how they differ, we wrote that up in AI visibility versus share of voice.
Build The Two Topic Groups In Qvery
Set up one topic per product line, filed under the money direction it belongs to, and put the questions from each pile under it as queries. Qvery generates a starting set when you onboard and you edit from there in plain language.
Once it is running you get the three numbers daily per topic, and every answer keeps the sources cited in it, tied to the query and the engine that produced it.
The Citations view is where those sources surface. It ranks the URLs and the domains behind your answers, each with a weight, filterable by engine and country, and the ranking exports.
To turn that into the list this article is about:
Open the Citations view for one direction's topics and read the Top Domains ranking.
Take rows from the top until adding another one stops changing what you would do about it. That is your working list, in priority order.
Do the same for the other direction.
Mark every row on both lists present, absent or stale for your brand, and mark the rows that appear on both.
One note on method. The counts in this article used a stricter definition than a top-ranked cut.
We took the smallest set of domains that together cover four fifths of the answers that cited any source, choosing them one at a time by how many still-uncovered answers each one adds, and a ranked list read from the top gets you a close and usable version of that same thing, which is what the product surfaces today.
Nine rows and ten rows are lists a team can work. Counting first is how you find out which one you have.
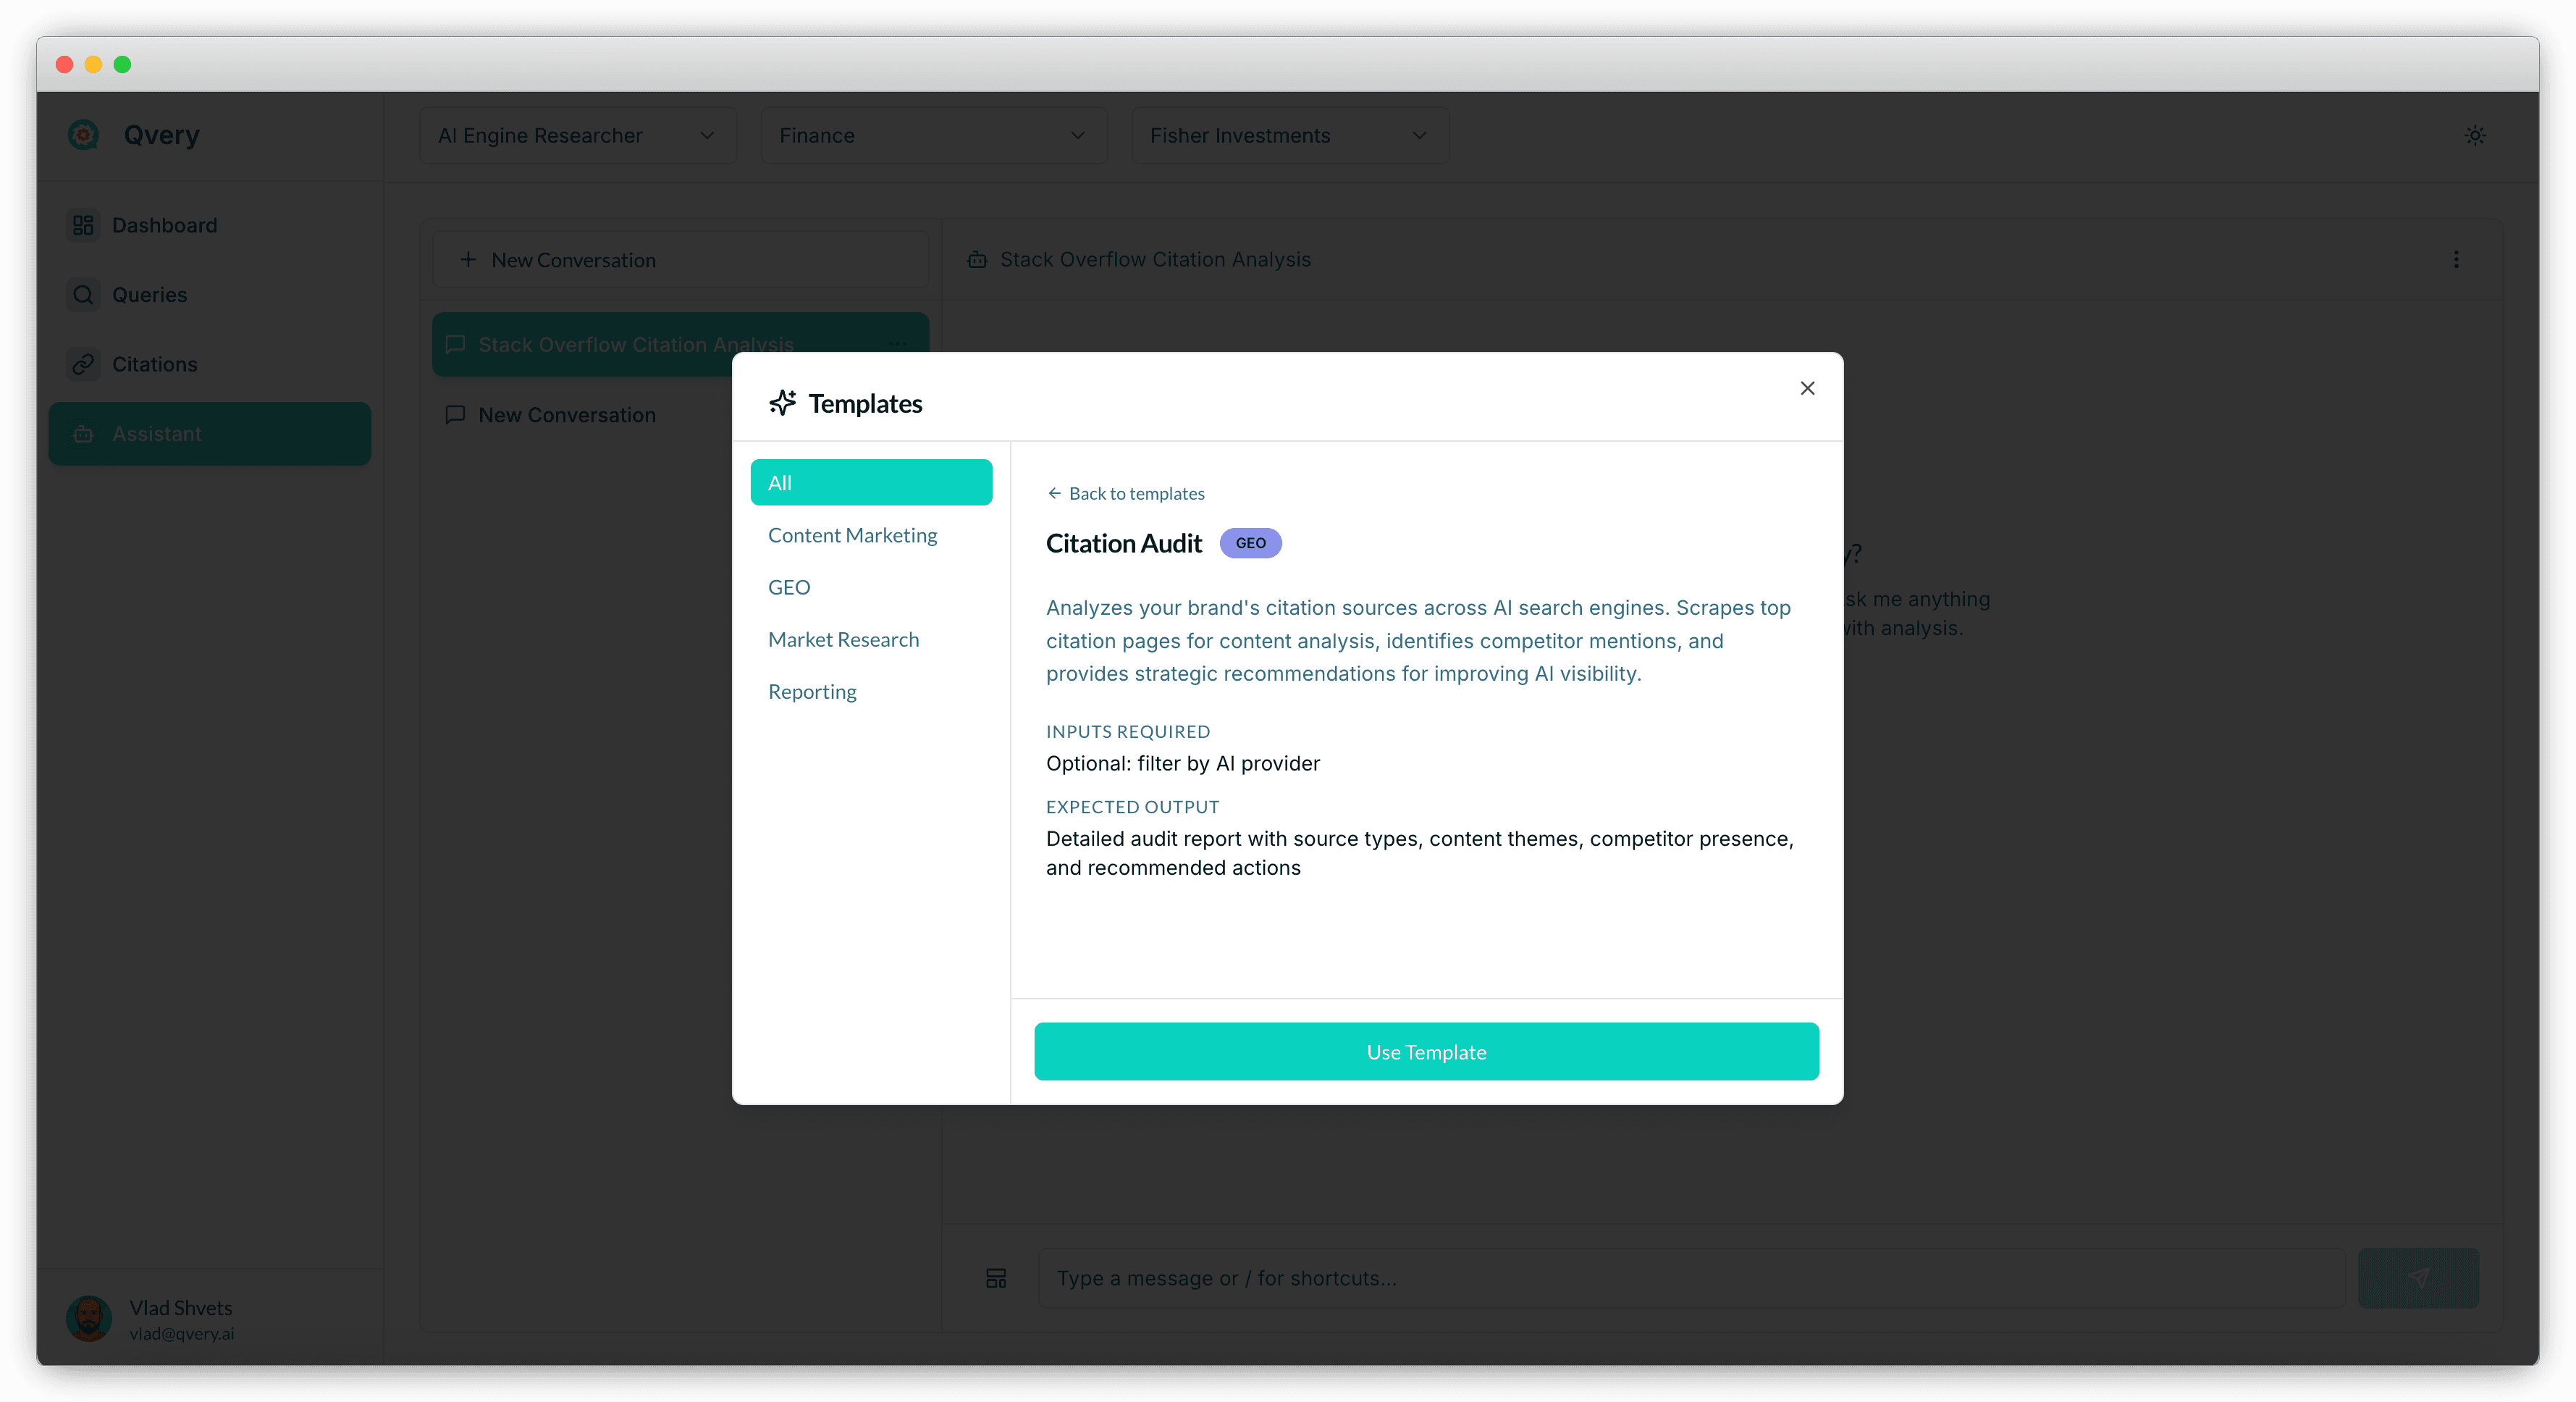
There is also a Citation Audit template in the Assistant. Its own description says it analyses your brand's citation sources across AI search engines and returns source types, content themes, competitor presence and recommended actions. Worth running as a first pass before you build the list by hand.
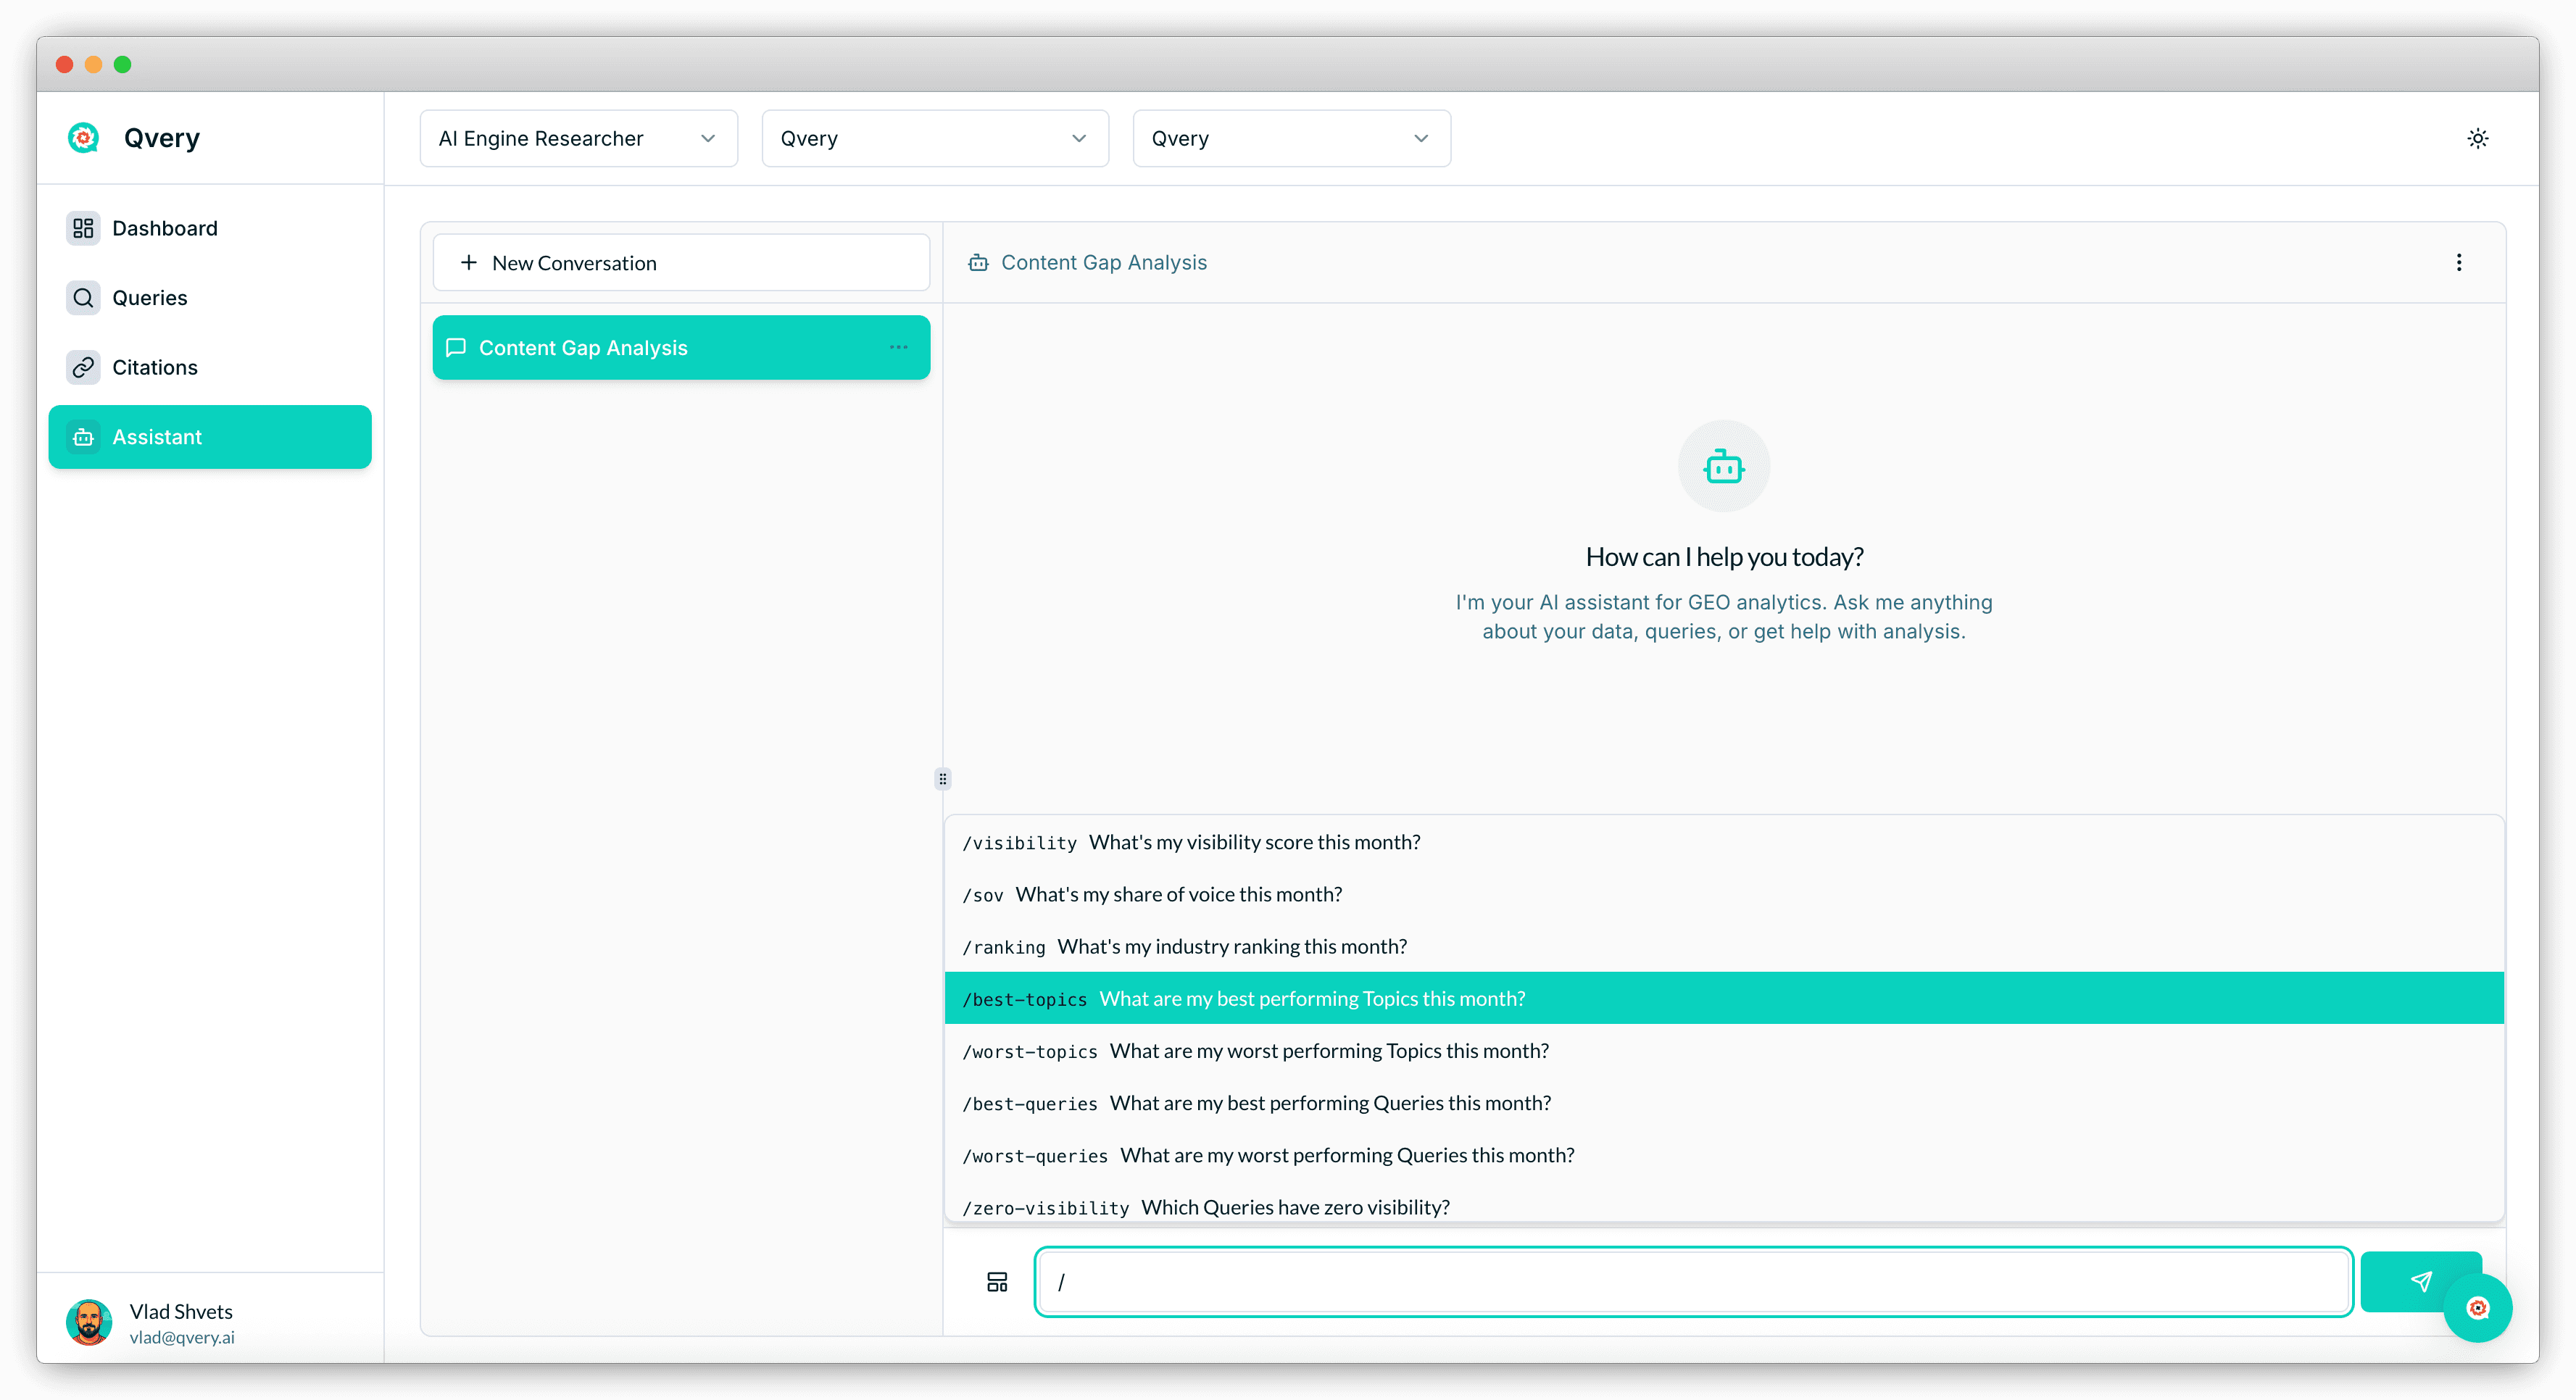
Then ask for the queries where your visibility is zero. Read that list before anything else: it is the only output of this exercise that arrives with its own to-do attached.
One boundary worth stating. The Citations view records which sources an answer cited and ranks them. It does not sort them into review hubs, regulators and marketplaces for you, and it does not tell you which brands the answer named in its text. Both of those reads are yours, done once, by hand.
Start a Qvery trial and set the two directions up as separate topics. The trial runs seven days free with no credit card, which is time to get the measurement configured and the first days of data in.
Take your two piles into the same room this week. If the two halves cite different domains, you already know which half your next piece of work belongs to.
Somebody forwards you an article about AI search. You are asked, in a meeting, what the company should do about it. You cannot say yet, because nobody has decided what to measure or what would count as a change.
That decision is smaller than it looks, and it is the one worth making first.
A consumer fintech line splits into two questions. Where a person is told to put money, and where they are told to get it. Track them as one blended set and you get a number that describes neither.
Track them separately and the first thing you learn is how much of the answer surface the two halves share. That is what decides whether you need one tracking set or two.
This is about the setup, not about a leaderboard. Nothing here says who wins.
Split Your Line By Money Direction First
Write out the questions your customers ask before they know your name. Then sort them into two piles.
Money in: where to open a savings account, which app to invest with, best high-yield account for an emergency fund, where to park cash for six months.
Money out: which card to get with fair credit, best buy-now-pay-later option, where to borrow for a renovation, which lender for a first car.
Plenty of fintech companies sell across that line. A neobank with a savings product and a card sits on both sides.
If your tracked query set is one undifferentiated bag labelled with your category, you are averaging two markets that behave differently. The average then belongs to whichever half you happened to write more queries for.
Keep both piles. Everything below reads off them.
Count The Rows Each Half Needs
The useful first measurement is not a share of voice. It is a count: how many websites do you have to care about at all?
Take one pile and find the smallest set of domains that covers half of the answers that cited any source, then the set that covers four fifths. Do it again for the other pile. Compare the two sets.
Across a targeted set of consumer fintech questions we ran on ChatGPT and Google AI Mode in September 2026, here is how that came out. It is a direction, not a census.
Money in: four domains cover half of the answers that cited any source. Nine cover four fifths.
Money out: four cover half. Ten cover four fifths.
Both working lists are short.
Nine and ten rows is a spreadsheet with owners and dates against it, not a programme. Worth knowing before anyone proposes a content plan.
The more useful number is the overlap. Three rows sit on both lists: NerdWallet, MoneySavingExpert and YouTube. The rest do not.
The money-in list carries Fidelity, the Wall Street Journal, Wealthsimple, the IRS, Canstar and Bankrate, while the money-out list carries Forbes, Ratehub, MoneyHelper, Experian, Afterpay, Discover and Scotiabank, which makes three shared rows out of a nine-row list a shared core with a tail on each side that belongs to one half only.
Treat the three shared rows as maintenance. They sit on both lists, so they are the rows to keep an eye on rather than the rows that separate you from anyone.
The Publisher Layer Answers Both Halves
Classify every cited domain by what kind of site it is and the shared core takes on a shape you can act on.
Personal-finance review hubs were present in 73.17% of answers that cited any source on the money-in side and 73.39% on the money-out side. Two figures that close at three significant figures is the finding here.
Whichever half of the line a buyer asks about, the same publisher layer is present in about the same share of the answers that cited anything at all. It is the one layer a fintech has to earn regardless of which products it sells this year.
Below that layer the two halves come apart. Comparison marketplaces and credit-score services were present in 30.65% of answers that cited any source on the money-out side and 3.25% on the money-in side.
Regulators and public bodies ran the other way, present in 26.02% of answers that cited any source on the money-in side and 15.32% on the money-out side. Video was present in 13.82% of answers that cited any source on the money-in side and 8.06% on the money-out side.
The layer that answers both halves is the one you have to earn. The layers that separate are the ones that tell you which half of your line a piece of work belongs to.
Careful about what that does and does not say. We counted which domains the answers cited. We did not measure why one review hub was cited and another was not, and a source being present in an answer is not the same as that source deciding the answer.
Check Where Your Own Domain Sits
Brands' own domains were present in 44.72% of answers that cited any source on the money-in side and 55.65% on the money-out side.
The gap looks like a difference and this study does not treat it as one. The ratio sits inside the band we set in advance for calling two figures equivalent, so we publish it as equivalent.
Those figures cover every brand's estate in the set, not yours specifically, which makes checking yours the cheapest item on the list. Run one question from each pile and look for your own domain in the citations.
If it is not there, go and look at the page before you conclude anything. Cheaper to investigate than a publisher you have to persuade.
Write The Query Set Before You Buy Anything
Judgment now, not findings. What a first pass should look like:
One topic per product line, filed under its direction. Products change names, the direction does not.
Your customers' words, including the constraint they mention out loud. Fair credit, first job, no fee, moving countries. Those constraints are how the questions get typed.
Your licensed countries, and only those. A blended global number averages markets you sell in with markets you do not.
Both engines separately. ChatGPT and Google AI Mode are the two Qvery tracks, and two numbers you can read beat one number that pools them.
A decided window and a decided threshold. One run is a sample. Write down how many days you will watch, and how far a number has to move before you treat it as a move rather than noise.
For what the three tracking numbers mean and how they differ, we wrote that up in AI visibility versus share of voice.
Build The Two Topic Groups In Qvery
Set up one topic per product line, filed under the money direction it belongs to, and put the questions from each pile under it as queries. Qvery generates a starting set when you onboard and you edit from there in plain language.
Once it is running you get the three numbers daily per topic, and every answer keeps the sources cited in it, tied to the query and the engine that produced it.
The Citations view is where those sources surface. It ranks the URLs and the domains behind your answers, each with a weight, filterable by engine and country, and the ranking exports.
To turn that into the list this article is about:
Open the Citations view for one direction's topics and read the Top Domains ranking.
Take rows from the top until adding another one stops changing what you would do about it. That is your working list, in priority order.
Do the same for the other direction.
Mark every row on both lists present, absent or stale for your brand, and mark the rows that appear on both.
One note on method. The counts in this article used a stricter definition than a top-ranked cut.
We took the smallest set of domains that together cover four fifths of the answers that cited any source, choosing them one at a time by how many still-uncovered answers each one adds, and a ranked list read from the top gets you a close and usable version of that same thing, which is what the product surfaces today.
Nine rows and ten rows are lists a team can work. Counting first is how you find out which one you have.
There is also a Citation Audit template in the Assistant. Its own description says it analyses your brand's citation sources across AI search engines and returns source types, content themes, competitor presence and recommended actions. Worth running as a first pass before you build the list by hand.
Then ask for the queries where your visibility is zero. Read that list before anything else: it is the only output of this exercise that arrives with its own to-do attached.
One boundary worth stating. The Citations view records which sources an answer cited and ranks them. It does not sort them into review hubs, regulators and marketplaces for you, and it does not tell you which brands the answer named in its text. Both of those reads are yours, done once, by hand.
Start a Qvery trial and set the two directions up as separate topics. The trial runs seven days free with no credit card, which is time to get the measurement configured and the first days of data in.
Take your two piles into the same room this week. If the two halves cite different domains, you already know which half your next piece of work belongs to.
Somebody forwards you an article about AI search. You are asked, in a meeting, what the company should do about it. You cannot say yet, because nobody has decided what to measure or what would count as a change.
That decision is smaller than it looks, and it is the one worth making first.
A consumer fintech line splits into two questions. Where a person is told to put money, and where they are told to get it. Track them as one blended set and you get a number that describes neither.
Track them separately and the first thing you learn is how much of the answer surface the two halves share. That is what decides whether you need one tracking set or two.
This is about the setup, not about a leaderboard. Nothing here says who wins.
Split Your Line By Money Direction First
Write out the questions your customers ask before they know your name. Then sort them into two piles.
Money in: where to open a savings account, which app to invest with, best high-yield account for an emergency fund, where to park cash for six months.
Money out: which card to get with fair credit, best buy-now-pay-later option, where to borrow for a renovation, which lender for a first car.
Plenty of fintech companies sell across that line. A neobank with a savings product and a card sits on both sides.
If your tracked query set is one undifferentiated bag labelled with your category, you are averaging two markets that behave differently. The average then belongs to whichever half you happened to write more queries for.
Keep both piles. Everything below reads off them.
Count The Rows Each Half Needs
The useful first measurement is not a share of voice. It is a count: how many websites do you have to care about at all?
Take one pile and find the smallest set of domains that covers half of the answers that cited any source, then the set that covers four fifths. Do it again for the other pile. Compare the two sets.
Across a targeted set of consumer fintech questions we ran on ChatGPT and Google AI Mode in September 2026, here is how that came out. It is a direction, not a census.
Money in: four domains cover half of the answers that cited any source. Nine cover four fifths.
Money out: four cover half. Ten cover four fifths.
Both working lists are short.
Nine and ten rows is a spreadsheet with owners and dates against it, not a programme. Worth knowing before anyone proposes a content plan.
The more useful number is the overlap. Three rows sit on both lists: NerdWallet, MoneySavingExpert and YouTube. The rest do not.
The money-in list carries Fidelity, the Wall Street Journal, Wealthsimple, the IRS, Canstar and Bankrate, while the money-out list carries Forbes, Ratehub, MoneyHelper, Experian, Afterpay, Discover and Scotiabank, which makes three shared rows out of a nine-row list a shared core with a tail on each side that belongs to one half only.
Treat the three shared rows as maintenance. They sit on both lists, so they are the rows to keep an eye on rather than the rows that separate you from anyone.
The Publisher Layer Answers Both Halves
Classify every cited domain by what kind of site it is and the shared core takes on a shape you can act on.
Personal-finance review hubs were present in 73.17% of answers that cited any source on the money-in side and 73.39% on the money-out side. Two figures that close at three significant figures is the finding here.
Whichever half of the line a buyer asks about, the same publisher layer is present in about the same share of the answers that cited anything at all. It is the one layer a fintech has to earn regardless of which products it sells this year.
Below that layer the two halves come apart. Comparison marketplaces and credit-score services were present in 30.65% of answers that cited any source on the money-out side and 3.25% on the money-in side.
Regulators and public bodies ran the other way, present in 26.02% of answers that cited any source on the money-in side and 15.32% on the money-out side. Video was present in 13.82% of answers that cited any source on the money-in side and 8.06% on the money-out side.
The layer that answers both halves is the one you have to earn. The layers that separate are the ones that tell you which half of your line a piece of work belongs to.
Careful about what that does and does not say. We counted which domains the answers cited. We did not measure why one review hub was cited and another was not, and a source being present in an answer is not the same as that source deciding the answer.
Check Where Your Own Domain Sits
Brands' own domains were present in 44.72% of answers that cited any source on the money-in side and 55.65% on the money-out side.
The gap looks like a difference and this study does not treat it as one. The ratio sits inside the band we set in advance for calling two figures equivalent, so we publish it as equivalent.
Those figures cover every brand's estate in the set, not yours specifically, which makes checking yours the cheapest item on the list. Run one question from each pile and look for your own domain in the citations.
If it is not there, go and look at the page before you conclude anything. Cheaper to investigate than a publisher you have to persuade.
Write The Query Set Before You Buy Anything
Judgment now, not findings. What a first pass should look like:
One topic per product line, filed under its direction. Products change names, the direction does not.
Your customers' words, including the constraint they mention out loud. Fair credit, first job, no fee, moving countries. Those constraints are how the questions get typed.
Your licensed countries, and only those. A blended global number averages markets you sell in with markets you do not.
Both engines separately. ChatGPT and Google AI Mode are the two Qvery tracks, and two numbers you can read beat one number that pools them.
A decided window and a decided threshold. One run is a sample. Write down how many days you will watch, and how far a number has to move before you treat it as a move rather than noise.
For what the three tracking numbers mean and how they differ, we wrote that up in AI visibility versus share of voice.
Build The Two Topic Groups In Qvery
Set up one topic per product line, filed under the money direction it belongs to, and put the questions from each pile under it as queries. Qvery generates a starting set when you onboard and you edit from there in plain language.
Once it is running you get the three numbers daily per topic, and every answer keeps the sources cited in it, tied to the query and the engine that produced it.
The Citations view is where those sources surface. It ranks the URLs and the domains behind your answers, each with a weight, filterable by engine and country, and the ranking exports.
To turn that into the list this article is about:
Open the Citations view for one direction's topics and read the Top Domains ranking.
Take rows from the top until adding another one stops changing what you would do about it. That is your working list, in priority order.
Do the same for the other direction.
Mark every row on both lists present, absent or stale for your brand, and mark the rows that appear on both.
One note on method. The counts in this article used a stricter definition than a top-ranked cut.
We took the smallest set of domains that together cover four fifths of the answers that cited any source, choosing them one at a time by how many still-uncovered answers each one adds, and a ranked list read from the top gets you a close and usable version of that same thing, which is what the product surfaces today.
Nine rows and ten rows are lists a team can work. Counting first is how you find out which one you have.
There is also a Citation Audit template in the Assistant. Its own description says it analyses your brand's citation sources across AI search engines and returns source types, content themes, competitor presence and recommended actions. Worth running as a first pass before you build the list by hand.
Then ask for the queries where your visibility is zero. Read that list before anything else: it is the only output of this exercise that arrives with its own to-do attached.
One boundary worth stating. The Citations view records which sources an answer cited and ranks them. It does not sort them into review hubs, regulators and marketplaces for you, and it does not tell you which brands the answer named in its text. Both of those reads are yours, done once, by hand.
Start a Qvery trial and set the two directions up as separate topics. The trial runs seven days free with no credit card, which is time to get the measurement configured and the first days of data in.
Take your two piles into the same room this week. If the two halves cite different domains, you already know which half your next piece of work belongs to.
Somebody forwards you an article about AI search. You are asked, in a meeting, what the company should do about it. You cannot say yet, because nobody has decided what to measure or what would count as a change.
That decision is smaller than it looks, and it is the one worth making first.
A consumer fintech line splits into two questions. Where a person is told to put money, and where they are told to get it. Track them as one blended set and you get a number that describes neither.
Track them separately and the first thing you learn is how much of the answer surface the two halves share. That is what decides whether you need one tracking set or two.
This is about the setup, not about a leaderboard. Nothing here says who wins.
Split Your Line By Money Direction First
Write out the questions your customers ask before they know your name. Then sort them into two piles.
Money in: where to open a savings account, which app to invest with, best high-yield account for an emergency fund, where to park cash for six months.
Money out: which card to get with fair credit, best buy-now-pay-later option, where to borrow for a renovation, which lender for a first car.
Plenty of fintech companies sell across that line. A neobank with a savings product and a card sits on both sides.
If your tracked query set is one undifferentiated bag labelled with your category, you are averaging two markets that behave differently. The average then belongs to whichever half you happened to write more queries for.
Keep both piles. Everything below reads off them.
Count The Rows Each Half Needs
The useful first measurement is not a share of voice. It is a count: how many websites do you have to care about at all?
Take one pile and find the smallest set of domains that covers half of the answers that cited any source, then the set that covers four fifths. Do it again for the other pile. Compare the two sets.
Across a targeted set of consumer fintech questions we ran on ChatGPT and Google AI Mode in September 2026, here is how that came out. It is a direction, not a census.
Money in: four domains cover half of the answers that cited any source. Nine cover four fifths.
Money out: four cover half. Ten cover four fifths.
Both working lists are short.
Nine and ten rows is a spreadsheet with owners and dates against it, not a programme. Worth knowing before anyone proposes a content plan.
The more useful number is the overlap. Three rows sit on both lists: NerdWallet, MoneySavingExpert and YouTube. The rest do not.
The money-in list carries Fidelity, the Wall Street Journal, Wealthsimple, the IRS, Canstar and Bankrate, while the money-out list carries Forbes, Ratehub, MoneyHelper, Experian, Afterpay, Discover and Scotiabank, which makes three shared rows out of a nine-row list a shared core with a tail on each side that belongs to one half only.
Treat the three shared rows as maintenance. They sit on both lists, so they are the rows to keep an eye on rather than the rows that separate you from anyone.
The Publisher Layer Answers Both Halves
Classify every cited domain by what kind of site it is and the shared core takes on a shape you can act on.
Personal-finance review hubs were present in 73.17% of answers that cited any source on the money-in side and 73.39% on the money-out side. Two figures that close at three significant figures is the finding here.
Whichever half of the line a buyer asks about, the same publisher layer is present in about the same share of the answers that cited anything at all. It is the one layer a fintech has to earn regardless of which products it sells this year.
Below that layer the two halves come apart. Comparison marketplaces and credit-score services were present in 30.65% of answers that cited any source on the money-out side and 3.25% on the money-in side.
Regulators and public bodies ran the other way, present in 26.02% of answers that cited any source on the money-in side and 15.32% on the money-out side. Video was present in 13.82% of answers that cited any source on the money-in side and 8.06% on the money-out side.
The layer that answers both halves is the one you have to earn. The layers that separate are the ones that tell you which half of your line a piece of work belongs to.
Careful about what that does and does not say. We counted which domains the answers cited. We did not measure why one review hub was cited and another was not, and a source being present in an answer is not the same as that source deciding the answer.
Check Where Your Own Domain Sits
Brands' own domains were present in 44.72% of answers that cited any source on the money-in side and 55.65% on the money-out side.
The gap looks like a difference and this study does not treat it as one. The ratio sits inside the band we set in advance for calling two figures equivalent, so we publish it as equivalent.
Those figures cover every brand's estate in the set, not yours specifically, which makes checking yours the cheapest item on the list. Run one question from each pile and look for your own domain in the citations.
If it is not there, go and look at the page before you conclude anything. Cheaper to investigate than a publisher you have to persuade.
Write The Query Set Before You Buy Anything
Judgment now, not findings. What a first pass should look like:
One topic per product line, filed under its direction. Products change names, the direction does not.
Your customers' words, including the constraint they mention out loud. Fair credit, first job, no fee, moving countries. Those constraints are how the questions get typed.
Your licensed countries, and only those. A blended global number averages markets you sell in with markets you do not.
Both engines separately. ChatGPT and Google AI Mode are the two Qvery tracks, and two numbers you can read beat one number that pools them.
A decided window and a decided threshold. One run is a sample. Write down how many days you will watch, and how far a number has to move before you treat it as a move rather than noise.
For what the three tracking numbers mean and how they differ, we wrote that up in AI visibility versus share of voice.
Build The Two Topic Groups In Qvery
Set up one topic per product line, filed under the money direction it belongs to, and put the questions from each pile under it as queries. Qvery generates a starting set when you onboard and you edit from there in plain language.
Once it is running you get the three numbers daily per topic, and every answer keeps the sources cited in it, tied to the query and the engine that produced it.
The Citations view is where those sources surface. It ranks the URLs and the domains behind your answers, each with a weight, filterable by engine and country, and the ranking exports.
To turn that into the list this article is about:
Open the Citations view for one direction's topics and read the Top Domains ranking.
Take rows from the top until adding another one stops changing what you would do about it. That is your working list, in priority order.
Do the same for the other direction.
Mark every row on both lists present, absent or stale for your brand, and mark the rows that appear on both.
One note on method. The counts in this article used a stricter definition than a top-ranked cut.
We took the smallest set of domains that together cover four fifths of the answers that cited any source, choosing them one at a time by how many still-uncovered answers each one adds, and a ranked list read from the top gets you a close and usable version of that same thing, which is what the product surfaces today.
Nine rows and ten rows are lists a team can work. Counting first is how you find out which one you have.
There is also a Citation Audit template in the Assistant. Its own description says it analyses your brand's citation sources across AI search engines and returns source types, content themes, competitor presence and recommended actions. Worth running as a first pass before you build the list by hand.
Then ask for the queries where your visibility is zero. Read that list before anything else: it is the only output of this exercise that arrives with its own to-do attached.
One boundary worth stating. The Citations view records which sources an answer cited and ranks them. It does not sort them into review hubs, regulators and marketplaces for you, and it does not tell you which brands the answer named in its text. Both of those reads are yours, done once, by hand.
Start a Qvery trial and set the two directions up as separate topics. The trial runs seven days free with no credit card, which is time to get the measurement configured and the first days of data in.
Take your two piles into the same room this week. If the two halves cite different domains, you already know which half your next piece of work belongs to.

© 2026 Qvery AI OÜ