By
Vlad Shvets
What AI Answers That Name Hotels Have in Common
Ask ChatGPT or Google AI Mode for a hotel recommendation and you get a confident shortlist. Ask what that shortlist was built from and the picture gets more...
Ask ChatGPT or Google AI Mode for a hotel recommendation and you get a confident shortlist. Ask what that shortlist was built from and the picture gets more...
Ask ChatGPT or Google AI Mode for a hotel recommendation and you get a confident shortlist. Ask what that shortlist was built from and the picture gets more...
Ask ChatGPT or Google AI Mode for a hotel recommendation and you get a confident shortlist. Ask what that shortlist was built from and the picture gets more interesting, because the answer changes completely depending on who is doing the asking.
We ran a targeted collection across hotel stay-decision queries, split three ways by city tier and four ways by traveler type, to find out when a hotel's own website is part of the answer and when it is nowhere near it.
The dimension the industry usually segments on turned out to barely matter. The one it rarely segments on turned out to move everything.
One boundary before any number. This measures which sources appear alongside AI answers. It does not measure whether a hotel's own site being present causes a recommendation, and nothing here was built to show that.
The Check That Reshaped This Article
We planned to report a full source composition of hotel answers, sorting every cited domain into several publisher categories.
Building that meant sorting every cited domain into one of those layers. Before using it, we validated the sorting against an independent second reader working blind, on a stratified sample, with a rule fixed in advance: agree at least 85% of the time or the composition does not get published.
Agreement came in at 78.3%. So the composition is not in this article.
The disagreements were not sloppiness. They sat on boundaries that resist a clean call. Is Autotrader a directory or a marketplace? Is Trivago a comparison site or a place you book?
Two careful readers can differ on those, and when they do, a published percentage built on the labels is decoration.
So we tested whether a narrower question could clear the same bar. One did, comfortably:
Is this domain the company's own website, or somebody else's? Agreement: 88.3%.
That question is simpler and considerably more useful to a hotel marketer. It asks whether you own the source or you do not. Everything below is built on it, and on a second binary that cleared 98.3%: is this a platform or community surface, or something else.
The bar never moved. A different question was tested against it and passed.
One more check saved this article from being wrong. A lookup like that only works to the extent it covers the sources people cite, and our first version covered under half of them. Every share it produced was biased downward, because an unlisted domain silently counts as third-party.
Extending it to 91.13% coverage moved the headline number for one segment by a factor of several. Then the extended classification failed an independent check and had to be rebuilt, which moved the numbers a third time.
Through all three versions the ordering of the segments held: business travel highest, budget lowest, every time. The magnitudes did not. That is worth knowing about any source-composition chart you are shown, including ours, so we report the coverage and the validation score alongside the results and would suggest asking for both.
Business Travel Questions Carry Owned Sites Furthest
Across a targeted set of hotel stay-decision queries spanning three city tiers and four traveler types, run on ChatGPT and Google AI Mode, August 2026, here is the share of cited answers containing at least one brand-owned source.
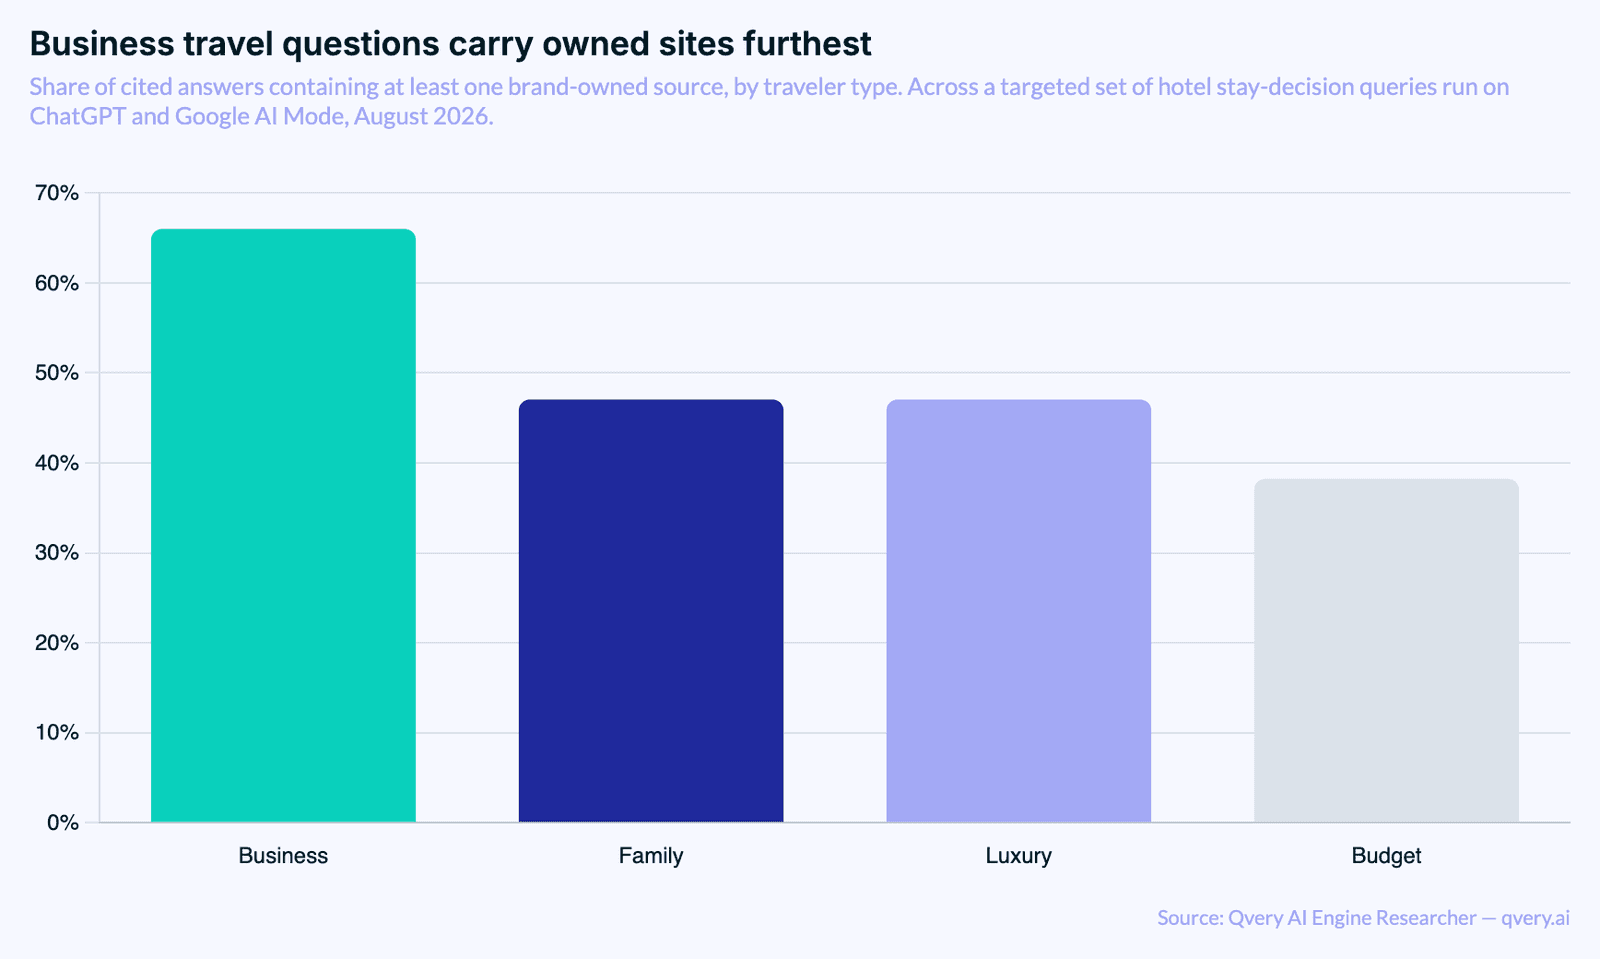
Business travel queries: a hotel's own domain appears in 66.02% of cited answers. Budget queries: 38.24%.
A 27.78-point spread across four arms of comparable size, all of which cleared our reporting floor.
Business travel sits well clear at the top. Family and luxury land in the same place as each other at 47.06%, and budget trails all three.
The likely reason budget trails is that those questions turn on price comparison, which is what third-party sites are built to answer. This collection cannot test that reading, so treat it as a hypothesis rather than a result.
One caution about precision before you act on these figures. The classification behind them cleared our validation bar at 85.3%, which is a pass and a narrow one. Read the ordering of these four arms as reliable and the exact percentages as approximate levels.
City Tier Moves It Nearly As Much
Now the same measure cut the way hotel marketing usually gets segmented, by the kind of city the property sits in.
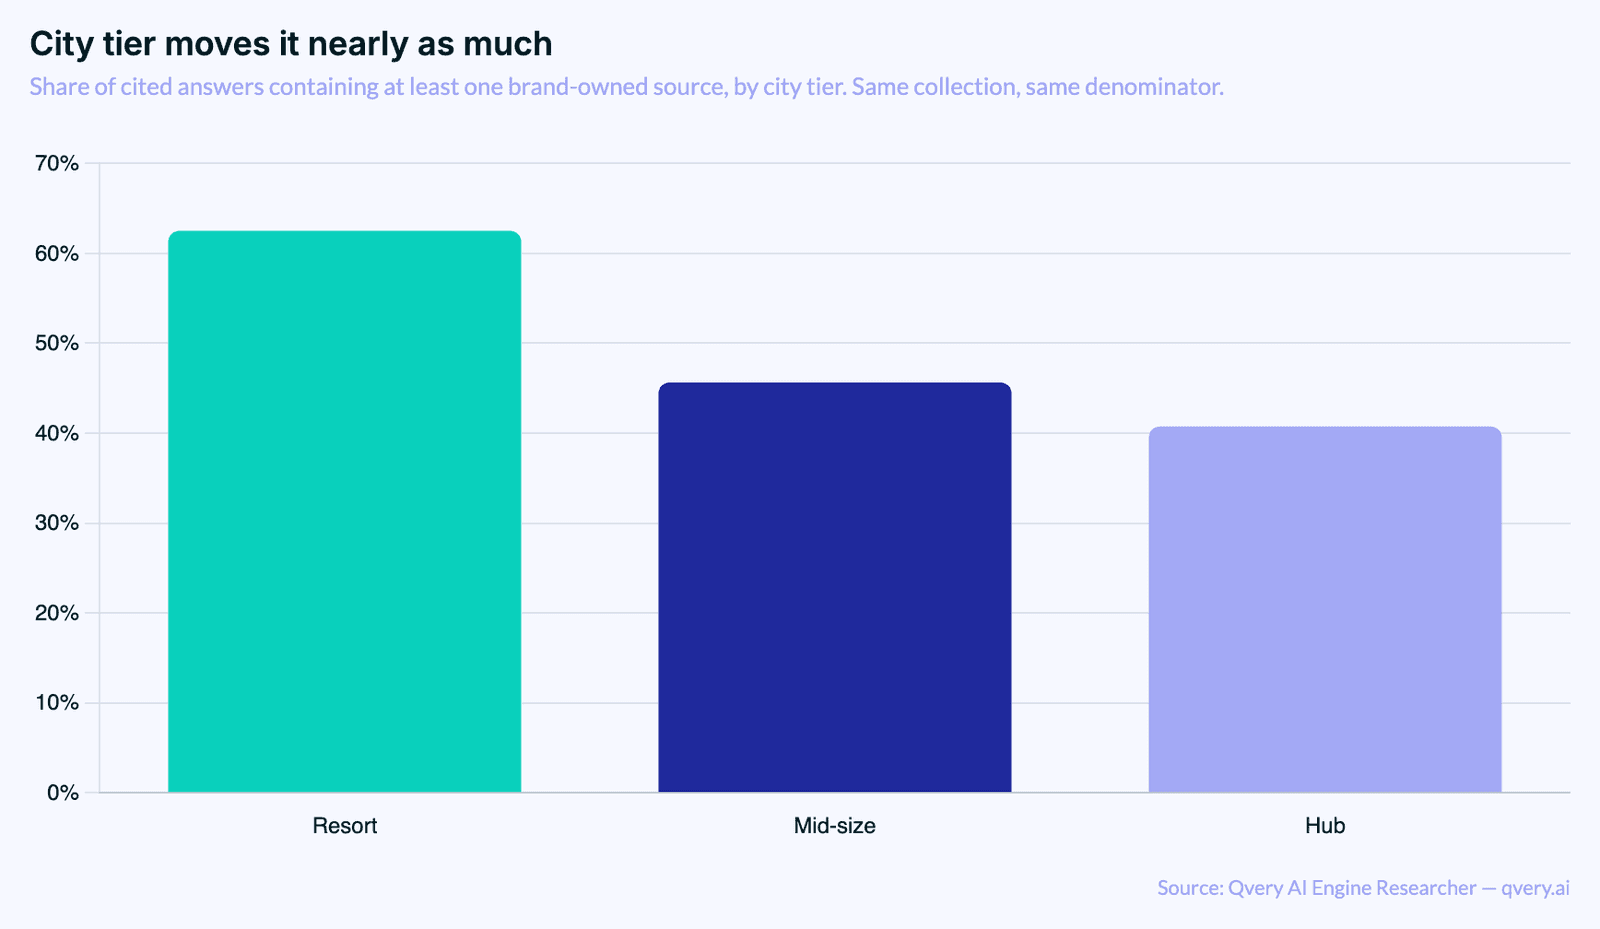
Resort at 62.50%, mid-size at 45.65%, hub at 40.74%. A spread of 21.76 points, against 27.78 across traveler types.
So both dimensions matter, at a ratio of about 1.28 times. Resort locations sit at the top of the tier cut at a level close to business travel's 66.02%, and hub cities sit at the bottom of it.
We are flagging this because an earlier version of our own analysis said geography was nearly flat here. A corrected and validated classification shows a 21.76-point spread instead, so that earlier reading was wrong. The correction is described in the next section.
We registered city tier as a primary dimension when we designed this collection, and the data disagreed with that design. Worth saying plainly, because it is the kind of assumption that gets baked into a reporting template and then never questioned.
Segment your visibility audit by who is asking, not by where the property sits.
What Sits Inside These Answers
Measured across all runs rather than only cited ones, and labeled as a separate denominator, the leading sources are a review directory and a community: tripadvisor.com at 46.01% and reddit.com at 41.19%, followed by expedia.com at 37.85%, google.com at 23.38%, then booking.com and hotels.com at 20.22% each.
Hotel groups do appear by name. marriott.com is in 14.66% of answers and hilton.com in 10.95%.
That contrast is worth holding onto. In our automotive collection, manufacturers' own channels were effectively absent from their own category. Hotel brands are present in theirs. Brand-owned presence is achievable here; the question the first chart answers is for whom.
A related detail that matters for how you scope an audit: several sources in this corpus are close to engine-exclusive. A hotel review publication that carries real weight on one engine's side is effectively invisible on the other's, and two large social platforms appear on one side only.
Pooling both engines into one source report hides that completely. You would come away with a middling share for a source that is either central or absent depending on which engine your customer opened, which is not a number anyone can act on.
The practical consequence is for reporting rather than allocation: a source report that pools both engines describes neither.
The Engine Difference In Platform And Community Sources
Which brings us to the sharpest split in the collection.
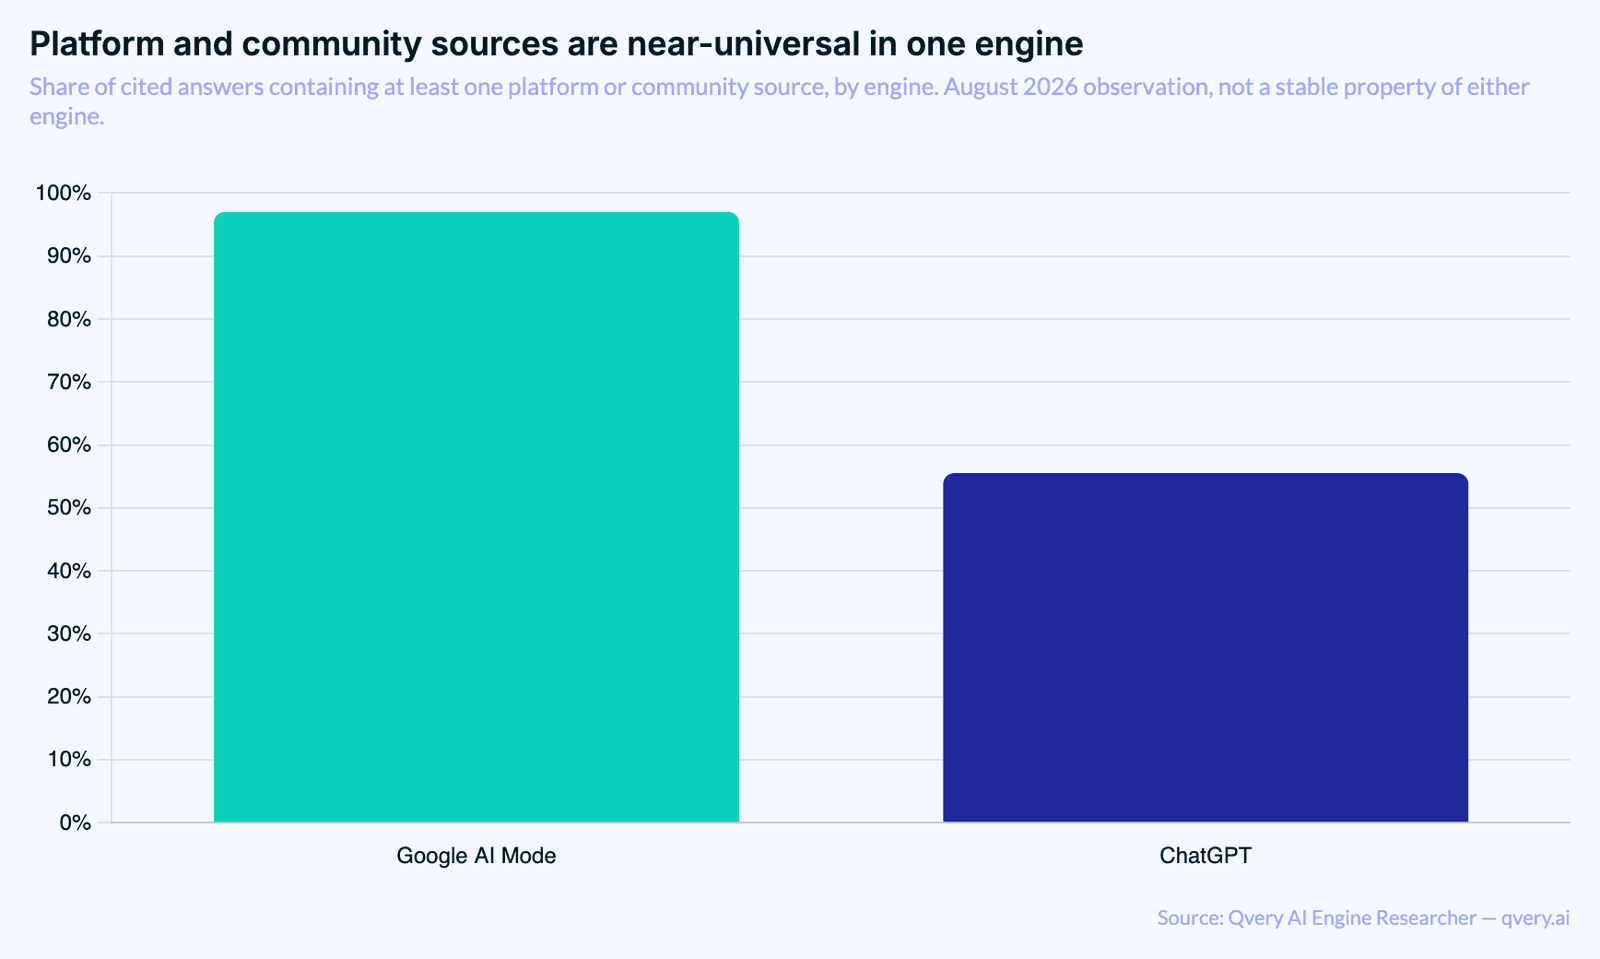
Platform and community sources appear in 97.01% of cited Google AI Mode answers and 55.53% of cited ChatGPT ones. A 1.75 times ratio, with both arms well above the floor we require for an engine comparison.
Read that as scope, not as advice. It is an August 2026 observation about where these sources show up, not a stable property of either engine and not a reason to prefer or defund one. What it does mean practically is that an audit which measures one engine and reports "community sources matter" or "community sources do not" is reporting an artifact of which engine it sampled.
On trigger behaviour: ChatGPT ran a search on 93.83% of its runs here, Google AI Mode on 100% of its own. Again an August observation, not a fixed engine property.
Running This On Your Own Property
Everything above is one collection at one moment. The version that helps you runs against your own property and your own competitive set, repeatedly.
Four things to get right:
These are the writer's judgment given this snapshot, not results. None of them is established by the collection.
Carry both traveler type and city tier. They move the measure by 27.78 and 21.76 points respectively, so dropping either one averages away a real difference.
Mark every cited source owned or third-party. That binary held up to independent checking at 88.3%. A richer taxonomy did not, so resist building your tracking around one.
Keep the engines separate. Given a 1.75 times difference on community sources and several near-exclusive domains, a pooled source report is not readable.
Log it over time. A single snapshot cannot tell you whether a source is structural in your category or a one-off. Only a repeated record separates them.
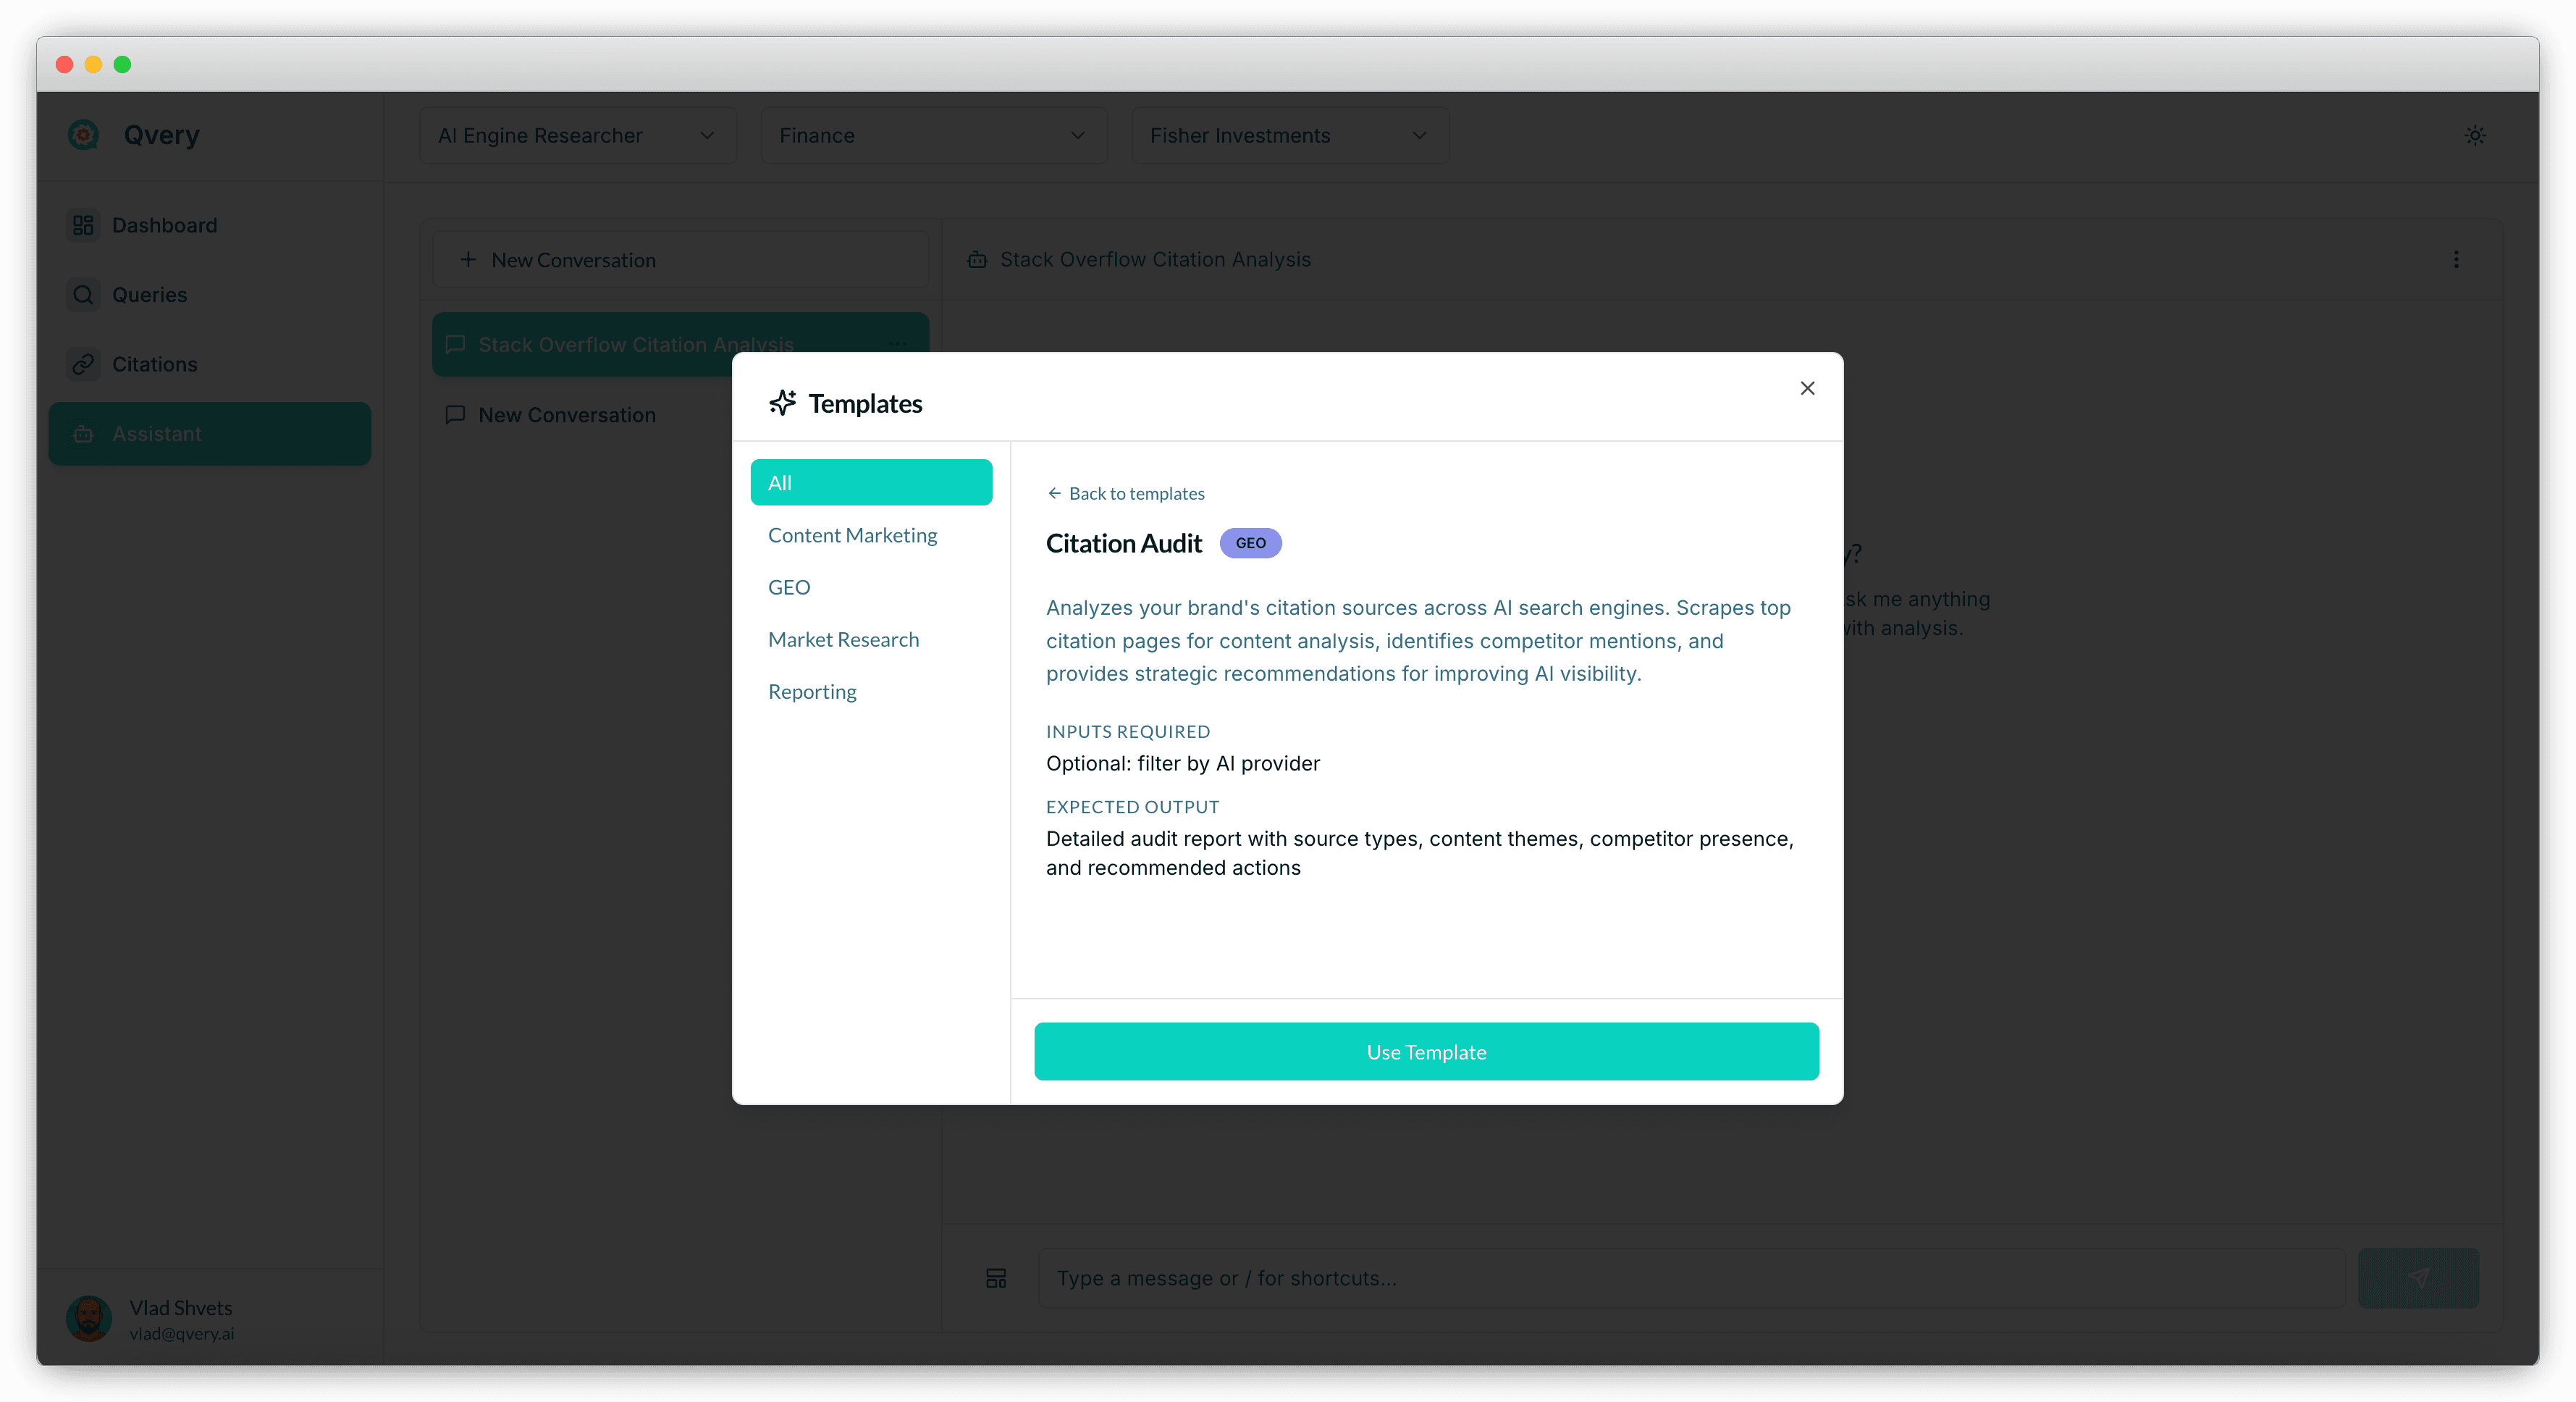
Qvery supplies the tracking underneath that. It tracks visibility, share of voice, and average rank across ChatGPT and Google AI Mode daily, in over 200 countries, and captures every citation tied to the query and engine that produced it. In Qvery Assistant you can ask about your own visibility, share of voice, citation, topic, and query data, add queries, trigger a run, or export a report.
The owned-versus-third-party marking and the traveler-segment tagging stay yours to maintain alongside those records, which after the validation result above is where that judgment belongs.
Start your free trial and split your first month of hotel citations by traveler type.
Writer's Judgment, Not A Finding
Flagging this clearly, because the rest of the article stays inside what was measured.
Given that owned sources appear in about two thirds of business-travel answers and under two fifths of budget ones, our judgment is that budget-segment visibility is the case where third-party surfaces deserve proportionally more of the effort. The 66.02% and 38.24% figures do not establish that.
That is a view about where effort is likely to pay. The collection does not establish it.
Given that a richer source taxonomy failed independent checking while a simple ownership binary passed, our judgment is that most hotel visibility reporting is carrying more category precision than it can support. That one is opinion too, though we would note we tested it on ourselves first and threw away a chart because of the answer.
What the collection did establish is narrower and firmer. Brand-owned presence runs from 66.02% of cited answers in business-travel questions down to 38.24% in budget ones, city tier moves the same measure by 21.76 points, and platform and community sources appear in 97.01% of cited answers on one engine against 55.53% on the other.
Those are the bounds, and they are approximate ones given a classifier that passed its check narrowly. What you do inside them is a decision, not a finding.
Ask ChatGPT or Google AI Mode for a hotel recommendation and you get a confident shortlist. Ask what that shortlist was built from and the picture gets more interesting, because the answer changes completely depending on who is doing the asking.
We ran a targeted collection across hotel stay-decision queries, split three ways by city tier and four ways by traveler type, to find out when a hotel's own website is part of the answer and when it is nowhere near it.
The dimension the industry usually segments on turned out to barely matter. The one it rarely segments on turned out to move everything.
One boundary before any number. This measures which sources appear alongside AI answers. It does not measure whether a hotel's own site being present causes a recommendation, and nothing here was built to show that.
The Check That Reshaped This Article
We planned to report a full source composition of hotel answers, sorting every cited domain into several publisher categories.
Building that meant sorting every cited domain into one of those layers. Before using it, we validated the sorting against an independent second reader working blind, on a stratified sample, with a rule fixed in advance: agree at least 85% of the time or the composition does not get published.
Agreement came in at 78.3%. So the composition is not in this article.
The disagreements were not sloppiness. They sat on boundaries that resist a clean call. Is Autotrader a directory or a marketplace? Is Trivago a comparison site or a place you book?
Two careful readers can differ on those, and when they do, a published percentage built on the labels is decoration.
So we tested whether a narrower question could clear the same bar. One did, comfortably:
Is this domain the company's own website, or somebody else's? Agreement: 88.3%.
That question is simpler and considerably more useful to a hotel marketer. It asks whether you own the source or you do not. Everything below is built on it, and on a second binary that cleared 98.3%: is this a platform or community surface, or something else.
The bar never moved. A different question was tested against it and passed.
One more check saved this article from being wrong. A lookup like that only works to the extent it covers the sources people cite, and our first version covered under half of them. Every share it produced was biased downward, because an unlisted domain silently counts as third-party.
Extending it to 91.13% coverage moved the headline number for one segment by a factor of several. Then the extended classification failed an independent check and had to be rebuilt, which moved the numbers a third time.
Through all three versions the ordering of the segments held: business travel highest, budget lowest, every time. The magnitudes did not. That is worth knowing about any source-composition chart you are shown, including ours, so we report the coverage and the validation score alongside the results and would suggest asking for both.
Business Travel Questions Carry Owned Sites Furthest
Across a targeted set of hotel stay-decision queries spanning three city tiers and four traveler types, run on ChatGPT and Google AI Mode, August 2026, here is the share of cited answers containing at least one brand-owned source.
Business travel queries: a hotel's own domain appears in 66.02% of cited answers. Budget queries: 38.24%.
A 27.78-point spread across four arms of comparable size, all of which cleared our reporting floor.
Business travel sits well clear at the top. Family and luxury land in the same place as each other at 47.06%, and budget trails all three.
The likely reason budget trails is that those questions turn on price comparison, which is what third-party sites are built to answer. This collection cannot test that reading, so treat it as a hypothesis rather than a result.
One caution about precision before you act on these figures. The classification behind them cleared our validation bar at 85.3%, which is a pass and a narrow one. Read the ordering of these four arms as reliable and the exact percentages as approximate levels.
City Tier Moves It Nearly As Much
Now the same measure cut the way hotel marketing usually gets segmented, by the kind of city the property sits in.
Resort at 62.50%, mid-size at 45.65%, hub at 40.74%. A spread of 21.76 points, against 27.78 across traveler types.
So both dimensions matter, at a ratio of about 1.28 times. Resort locations sit at the top of the tier cut at a level close to business travel's 66.02%, and hub cities sit at the bottom of it.
We are flagging this because an earlier version of our own analysis said geography was nearly flat here. A corrected and validated classification shows a 21.76-point spread instead, so that earlier reading was wrong. The correction is described in the next section.
We registered city tier as a primary dimension when we designed this collection, and the data disagreed with that design. Worth saying plainly, because it is the kind of assumption that gets baked into a reporting template and then never questioned.
Segment your visibility audit by who is asking, not by where the property sits.
What Sits Inside These Answers
Measured across all runs rather than only cited ones, and labeled as a separate denominator, the leading sources are a review directory and a community: tripadvisor.com at 46.01% and reddit.com at 41.19%, followed by expedia.com at 37.85%, google.com at 23.38%, then booking.com and hotels.com at 20.22% each.
Hotel groups do appear by name. marriott.com is in 14.66% of answers and hilton.com in 10.95%.
That contrast is worth holding onto. In our automotive collection, manufacturers' own channels were effectively absent from their own category. Hotel brands are present in theirs. Brand-owned presence is achievable here; the question the first chart answers is for whom.
A related detail that matters for how you scope an audit: several sources in this corpus are close to engine-exclusive. A hotel review publication that carries real weight on one engine's side is effectively invisible on the other's, and two large social platforms appear on one side only.
Pooling both engines into one source report hides that completely. You would come away with a middling share for a source that is either central or absent depending on which engine your customer opened, which is not a number anyone can act on.
The practical consequence is for reporting rather than allocation: a source report that pools both engines describes neither.
The Engine Difference In Platform And Community Sources
Which brings us to the sharpest split in the collection.
Platform and community sources appear in 97.01% of cited Google AI Mode answers and 55.53% of cited ChatGPT ones. A 1.75 times ratio, with both arms well above the floor we require for an engine comparison.
Read that as scope, not as advice. It is an August 2026 observation about where these sources show up, not a stable property of either engine and not a reason to prefer or defund one. What it does mean practically is that an audit which measures one engine and reports "community sources matter" or "community sources do not" is reporting an artifact of which engine it sampled.
On trigger behaviour: ChatGPT ran a search on 93.83% of its runs here, Google AI Mode on 100% of its own. Again an August observation, not a fixed engine property.
Running This On Your Own Property
Everything above is one collection at one moment. The version that helps you runs against your own property and your own competitive set, repeatedly.
Four things to get right:
These are the writer's judgment given this snapshot, not results. None of them is established by the collection.
Carry both traveler type and city tier. They move the measure by 27.78 and 21.76 points respectively, so dropping either one averages away a real difference.
Mark every cited source owned or third-party. That binary held up to independent checking at 88.3%. A richer taxonomy did not, so resist building your tracking around one.
Keep the engines separate. Given a 1.75 times difference on community sources and several near-exclusive domains, a pooled source report is not readable.
Log it over time. A single snapshot cannot tell you whether a source is structural in your category or a one-off. Only a repeated record separates them.
Qvery supplies the tracking underneath that. It tracks visibility, share of voice, and average rank across ChatGPT and Google AI Mode daily, in over 200 countries, and captures every citation tied to the query and engine that produced it. In Qvery Assistant you can ask about your own visibility, share of voice, citation, topic, and query data, add queries, trigger a run, or export a report.
The owned-versus-third-party marking and the traveler-segment tagging stay yours to maintain alongside those records, which after the validation result above is where that judgment belongs.
Start your free trial and split your first month of hotel citations by traveler type.
Writer's Judgment, Not A Finding
Flagging this clearly, because the rest of the article stays inside what was measured.
Given that owned sources appear in about two thirds of business-travel answers and under two fifths of budget ones, our judgment is that budget-segment visibility is the case where third-party surfaces deserve proportionally more of the effort. The 66.02% and 38.24% figures do not establish that.
That is a view about where effort is likely to pay. The collection does not establish it.
Given that a richer source taxonomy failed independent checking while a simple ownership binary passed, our judgment is that most hotel visibility reporting is carrying more category precision than it can support. That one is opinion too, though we would note we tested it on ourselves first and threw away a chart because of the answer.
What the collection did establish is narrower and firmer. Brand-owned presence runs from 66.02% of cited answers in business-travel questions down to 38.24% in budget ones, city tier moves the same measure by 21.76 points, and platform and community sources appear in 97.01% of cited answers on one engine against 55.53% on the other.
Those are the bounds, and they are approximate ones given a classifier that passed its check narrowly. What you do inside them is a decision, not a finding.
Ask ChatGPT or Google AI Mode for a hotel recommendation and you get a confident shortlist. Ask what that shortlist was built from and the picture gets more interesting, because the answer changes completely depending on who is doing the asking.
We ran a targeted collection across hotel stay-decision queries, split three ways by city tier and four ways by traveler type, to find out when a hotel's own website is part of the answer and when it is nowhere near it.
The dimension the industry usually segments on turned out to barely matter. The one it rarely segments on turned out to move everything.
One boundary before any number. This measures which sources appear alongside AI answers. It does not measure whether a hotel's own site being present causes a recommendation, and nothing here was built to show that.
The Check That Reshaped This Article
We planned to report a full source composition of hotel answers, sorting every cited domain into several publisher categories.
Building that meant sorting every cited domain into one of those layers. Before using it, we validated the sorting against an independent second reader working blind, on a stratified sample, with a rule fixed in advance: agree at least 85% of the time or the composition does not get published.
Agreement came in at 78.3%. So the composition is not in this article.
The disagreements were not sloppiness. They sat on boundaries that resist a clean call. Is Autotrader a directory or a marketplace? Is Trivago a comparison site or a place you book?
Two careful readers can differ on those, and when they do, a published percentage built on the labels is decoration.
So we tested whether a narrower question could clear the same bar. One did, comfortably:
Is this domain the company's own website, or somebody else's? Agreement: 88.3%.
That question is simpler and considerably more useful to a hotel marketer. It asks whether you own the source or you do not. Everything below is built on it, and on a second binary that cleared 98.3%: is this a platform or community surface, or something else.
The bar never moved. A different question was tested against it and passed.
One more check saved this article from being wrong. A lookup like that only works to the extent it covers the sources people cite, and our first version covered under half of them. Every share it produced was biased downward, because an unlisted domain silently counts as third-party.
Extending it to 91.13% coverage moved the headline number for one segment by a factor of several. Then the extended classification failed an independent check and had to be rebuilt, which moved the numbers a third time.
Through all three versions the ordering of the segments held: business travel highest, budget lowest, every time. The magnitudes did not. That is worth knowing about any source-composition chart you are shown, including ours, so we report the coverage and the validation score alongside the results and would suggest asking for both.
Business Travel Questions Carry Owned Sites Furthest
Across a targeted set of hotel stay-decision queries spanning three city tiers and four traveler types, run on ChatGPT and Google AI Mode, August 2026, here is the share of cited answers containing at least one brand-owned source.
Business travel queries: a hotel's own domain appears in 66.02% of cited answers. Budget queries: 38.24%.
A 27.78-point spread across four arms of comparable size, all of which cleared our reporting floor.
Business travel sits well clear at the top. Family and luxury land in the same place as each other at 47.06%, and budget trails all three.
The likely reason budget trails is that those questions turn on price comparison, which is what third-party sites are built to answer. This collection cannot test that reading, so treat it as a hypothesis rather than a result.
One caution about precision before you act on these figures. The classification behind them cleared our validation bar at 85.3%, which is a pass and a narrow one. Read the ordering of these four arms as reliable and the exact percentages as approximate levels.
City Tier Moves It Nearly As Much
Now the same measure cut the way hotel marketing usually gets segmented, by the kind of city the property sits in.
Resort at 62.50%, mid-size at 45.65%, hub at 40.74%. A spread of 21.76 points, against 27.78 across traveler types.
So both dimensions matter, at a ratio of about 1.28 times. Resort locations sit at the top of the tier cut at a level close to business travel's 66.02%, and hub cities sit at the bottom of it.
We are flagging this because an earlier version of our own analysis said geography was nearly flat here. A corrected and validated classification shows a 21.76-point spread instead, so that earlier reading was wrong. The correction is described in the next section.
We registered city tier as a primary dimension when we designed this collection, and the data disagreed with that design. Worth saying plainly, because it is the kind of assumption that gets baked into a reporting template and then never questioned.
Segment your visibility audit by who is asking, not by where the property sits.
What Sits Inside These Answers
Measured across all runs rather than only cited ones, and labeled as a separate denominator, the leading sources are a review directory and a community: tripadvisor.com at 46.01% and reddit.com at 41.19%, followed by expedia.com at 37.85%, google.com at 23.38%, then booking.com and hotels.com at 20.22% each.
Hotel groups do appear by name. marriott.com is in 14.66% of answers and hilton.com in 10.95%.
That contrast is worth holding onto. In our automotive collection, manufacturers' own channels were effectively absent from their own category. Hotel brands are present in theirs. Brand-owned presence is achievable here; the question the first chart answers is for whom.
A related detail that matters for how you scope an audit: several sources in this corpus are close to engine-exclusive. A hotel review publication that carries real weight on one engine's side is effectively invisible on the other's, and two large social platforms appear on one side only.
Pooling both engines into one source report hides that completely. You would come away with a middling share for a source that is either central or absent depending on which engine your customer opened, which is not a number anyone can act on.
The practical consequence is for reporting rather than allocation: a source report that pools both engines describes neither.
The Engine Difference In Platform And Community Sources
Which brings us to the sharpest split in the collection.
Platform and community sources appear in 97.01% of cited Google AI Mode answers and 55.53% of cited ChatGPT ones. A 1.75 times ratio, with both arms well above the floor we require for an engine comparison.
Read that as scope, not as advice. It is an August 2026 observation about where these sources show up, not a stable property of either engine and not a reason to prefer or defund one. What it does mean practically is that an audit which measures one engine and reports "community sources matter" or "community sources do not" is reporting an artifact of which engine it sampled.
On trigger behaviour: ChatGPT ran a search on 93.83% of its runs here, Google AI Mode on 100% of its own. Again an August observation, not a fixed engine property.
Running This On Your Own Property
Everything above is one collection at one moment. The version that helps you runs against your own property and your own competitive set, repeatedly.
Four things to get right:
These are the writer's judgment given this snapshot, not results. None of them is established by the collection.
Carry both traveler type and city tier. They move the measure by 27.78 and 21.76 points respectively, so dropping either one averages away a real difference.
Mark every cited source owned or third-party. That binary held up to independent checking at 88.3%. A richer taxonomy did not, so resist building your tracking around one.
Keep the engines separate. Given a 1.75 times difference on community sources and several near-exclusive domains, a pooled source report is not readable.
Log it over time. A single snapshot cannot tell you whether a source is structural in your category or a one-off. Only a repeated record separates them.
Qvery supplies the tracking underneath that. It tracks visibility, share of voice, and average rank across ChatGPT and Google AI Mode daily, in over 200 countries, and captures every citation tied to the query and engine that produced it. In Qvery Assistant you can ask about your own visibility, share of voice, citation, topic, and query data, add queries, trigger a run, or export a report.
The owned-versus-third-party marking and the traveler-segment tagging stay yours to maintain alongside those records, which after the validation result above is where that judgment belongs.
Start your free trial and split your first month of hotel citations by traveler type.
Writer's Judgment, Not A Finding
Flagging this clearly, because the rest of the article stays inside what was measured.
Given that owned sources appear in about two thirds of business-travel answers and under two fifths of budget ones, our judgment is that budget-segment visibility is the case where third-party surfaces deserve proportionally more of the effort. The 66.02% and 38.24% figures do not establish that.
That is a view about where effort is likely to pay. The collection does not establish it.
Given that a richer source taxonomy failed independent checking while a simple ownership binary passed, our judgment is that most hotel visibility reporting is carrying more category precision than it can support. That one is opinion too, though we would note we tested it on ourselves first and threw away a chart because of the answer.
What the collection did establish is narrower and firmer. Brand-owned presence runs from 66.02% of cited answers in business-travel questions down to 38.24% in budget ones, city tier moves the same measure by 21.76 points, and platform and community sources appear in 97.01% of cited answers on one engine against 55.53% on the other.
Those are the bounds, and they are approximate ones given a classifier that passed its check narrowly. What you do inside them is a decision, not a finding.
Ask ChatGPT or Google AI Mode for a hotel recommendation and you get a confident shortlist. Ask what that shortlist was built from and the picture gets more interesting, because the answer changes completely depending on who is doing the asking.
We ran a targeted collection across hotel stay-decision queries, split three ways by city tier and four ways by traveler type, to find out when a hotel's own website is part of the answer and when it is nowhere near it.
The dimension the industry usually segments on turned out to barely matter. The one it rarely segments on turned out to move everything.
One boundary before any number. This measures which sources appear alongside AI answers. It does not measure whether a hotel's own site being present causes a recommendation, and nothing here was built to show that.
The Check That Reshaped This Article
We planned to report a full source composition of hotel answers, sorting every cited domain into several publisher categories.
Building that meant sorting every cited domain into one of those layers. Before using it, we validated the sorting against an independent second reader working blind, on a stratified sample, with a rule fixed in advance: agree at least 85% of the time or the composition does not get published.
Agreement came in at 78.3%. So the composition is not in this article.
The disagreements were not sloppiness. They sat on boundaries that resist a clean call. Is Autotrader a directory or a marketplace? Is Trivago a comparison site or a place you book?
Two careful readers can differ on those, and when they do, a published percentage built on the labels is decoration.
So we tested whether a narrower question could clear the same bar. One did, comfortably:
Is this domain the company's own website, or somebody else's? Agreement: 88.3%.
That question is simpler and considerably more useful to a hotel marketer. It asks whether you own the source or you do not. Everything below is built on it, and on a second binary that cleared 98.3%: is this a platform or community surface, or something else.
The bar never moved. A different question was tested against it and passed.
One more check saved this article from being wrong. A lookup like that only works to the extent it covers the sources people cite, and our first version covered under half of them. Every share it produced was biased downward, because an unlisted domain silently counts as third-party.
Extending it to 91.13% coverage moved the headline number for one segment by a factor of several. Then the extended classification failed an independent check and had to be rebuilt, which moved the numbers a third time.
Through all three versions the ordering of the segments held: business travel highest, budget lowest, every time. The magnitudes did not. That is worth knowing about any source-composition chart you are shown, including ours, so we report the coverage and the validation score alongside the results and would suggest asking for both.
Business Travel Questions Carry Owned Sites Furthest
Across a targeted set of hotel stay-decision queries spanning three city tiers and four traveler types, run on ChatGPT and Google AI Mode, August 2026, here is the share of cited answers containing at least one brand-owned source.
Business travel queries: a hotel's own domain appears in 66.02% of cited answers. Budget queries: 38.24%.
A 27.78-point spread across four arms of comparable size, all of which cleared our reporting floor.
Business travel sits well clear at the top. Family and luxury land in the same place as each other at 47.06%, and budget trails all three.
The likely reason budget trails is that those questions turn on price comparison, which is what third-party sites are built to answer. This collection cannot test that reading, so treat it as a hypothesis rather than a result.
One caution about precision before you act on these figures. The classification behind them cleared our validation bar at 85.3%, which is a pass and a narrow one. Read the ordering of these four arms as reliable and the exact percentages as approximate levels.
City Tier Moves It Nearly As Much
Now the same measure cut the way hotel marketing usually gets segmented, by the kind of city the property sits in.
Resort at 62.50%, mid-size at 45.65%, hub at 40.74%. A spread of 21.76 points, against 27.78 across traveler types.
So both dimensions matter, at a ratio of about 1.28 times. Resort locations sit at the top of the tier cut at a level close to business travel's 66.02%, and hub cities sit at the bottom of it.
We are flagging this because an earlier version of our own analysis said geography was nearly flat here. A corrected and validated classification shows a 21.76-point spread instead, so that earlier reading was wrong. The correction is described in the next section.
We registered city tier as a primary dimension when we designed this collection, and the data disagreed with that design. Worth saying plainly, because it is the kind of assumption that gets baked into a reporting template and then never questioned.
Segment your visibility audit by who is asking, not by where the property sits.
What Sits Inside These Answers
Measured across all runs rather than only cited ones, and labeled as a separate denominator, the leading sources are a review directory and a community: tripadvisor.com at 46.01% and reddit.com at 41.19%, followed by expedia.com at 37.85%, google.com at 23.38%, then booking.com and hotels.com at 20.22% each.
Hotel groups do appear by name. marriott.com is in 14.66% of answers and hilton.com in 10.95%.
That contrast is worth holding onto. In our automotive collection, manufacturers' own channels were effectively absent from their own category. Hotel brands are present in theirs. Brand-owned presence is achievable here; the question the first chart answers is for whom.
A related detail that matters for how you scope an audit: several sources in this corpus are close to engine-exclusive. A hotel review publication that carries real weight on one engine's side is effectively invisible on the other's, and two large social platforms appear on one side only.
Pooling both engines into one source report hides that completely. You would come away with a middling share for a source that is either central or absent depending on which engine your customer opened, which is not a number anyone can act on.
The practical consequence is for reporting rather than allocation: a source report that pools both engines describes neither.
The Engine Difference In Platform And Community Sources
Which brings us to the sharpest split in the collection.
Platform and community sources appear in 97.01% of cited Google AI Mode answers and 55.53% of cited ChatGPT ones. A 1.75 times ratio, with both arms well above the floor we require for an engine comparison.
Read that as scope, not as advice. It is an August 2026 observation about where these sources show up, not a stable property of either engine and not a reason to prefer or defund one. What it does mean practically is that an audit which measures one engine and reports "community sources matter" or "community sources do not" is reporting an artifact of which engine it sampled.
On trigger behaviour: ChatGPT ran a search on 93.83% of its runs here, Google AI Mode on 100% of its own. Again an August observation, not a fixed engine property.
Running This On Your Own Property
Everything above is one collection at one moment. The version that helps you runs against your own property and your own competitive set, repeatedly.
Four things to get right:
These are the writer's judgment given this snapshot, not results. None of them is established by the collection.
Carry both traveler type and city tier. They move the measure by 27.78 and 21.76 points respectively, so dropping either one averages away a real difference.
Mark every cited source owned or third-party. That binary held up to independent checking at 88.3%. A richer taxonomy did not, so resist building your tracking around one.
Keep the engines separate. Given a 1.75 times difference on community sources and several near-exclusive domains, a pooled source report is not readable.
Log it over time. A single snapshot cannot tell you whether a source is structural in your category or a one-off. Only a repeated record separates them.
Qvery supplies the tracking underneath that. It tracks visibility, share of voice, and average rank across ChatGPT and Google AI Mode daily, in over 200 countries, and captures every citation tied to the query and engine that produced it. In Qvery Assistant you can ask about your own visibility, share of voice, citation, topic, and query data, add queries, trigger a run, or export a report.
The owned-versus-third-party marking and the traveler-segment tagging stay yours to maintain alongside those records, which after the validation result above is where that judgment belongs.
Start your free trial and split your first month of hotel citations by traveler type.
Writer's Judgment, Not A Finding
Flagging this clearly, because the rest of the article stays inside what was measured.
Given that owned sources appear in about two thirds of business-travel answers and under two fifths of budget ones, our judgment is that budget-segment visibility is the case where third-party surfaces deserve proportionally more of the effort. The 66.02% and 38.24% figures do not establish that.
That is a view about where effort is likely to pay. The collection does not establish it.
Given that a richer source taxonomy failed independent checking while a simple ownership binary passed, our judgment is that most hotel visibility reporting is carrying more category precision than it can support. That one is opinion too, though we would note we tested it on ourselves first and threw away a chart because of the answer.
What the collection did establish is narrower and firmer. Brand-owned presence runs from 66.02% of cited answers in business-travel questions down to 38.24% in budget ones, city tier moves the same measure by 21.76 points, and platform and community sources appear in 97.01% of cited answers on one engine against 55.53% on the other.
Those are the bounds, and they are approximate ones given a classifier that passed its check narrowly. What you do inside them is a decision, not a finding.

© 2026 Qvery AI OÜ