By
Vlad Shvets
Telehealth Brand Visibility in AI Answers: A Directional Probe
Telehealth sits in the category AI engines are most careful about. Health questions attract caution, and the usual assumption is that both engines fall back...
Telehealth sits in the category AI engines are most careful about. Health questions attract caution, and the usual assumption is that both engines fall back...
Telehealth sits in the category AI engines are most careful about. Health questions attract caution, and the usual assumption is that both engines fall back...
Telehealth sits in the category AI engines are most careful about. Health questions attract caution, and the usual assumption is that both engines fall back on institutional sources when the topic gets medical.
Half of that assumption held up. The other half turned out to be an engine-specific behaviour, and it points the two engines in opposite directions.
One boundary before any number. This measures which sources appear alongside the answers. It does not measure whether appearing on a source causes a provider to be recommended, and nothing here was designed to test that.
A Prediction We Wrote Down Before Collecting
Before running anything, we registered a specific hypothesis: that Google AI Mode's telehealth answers would cite providers' own websites at least 1.5 times as often as ChatGPT's.
We wrote down what would falsify it too. Below 1.5 times and the hypothesis dies, published either way.
Across a targeted set of telehealth queries spanning general virtual care, four condition areas, and cost and access questions, run on ChatGPT and Google AI Mode, August 2026, the ratio came in at 2.10 times.
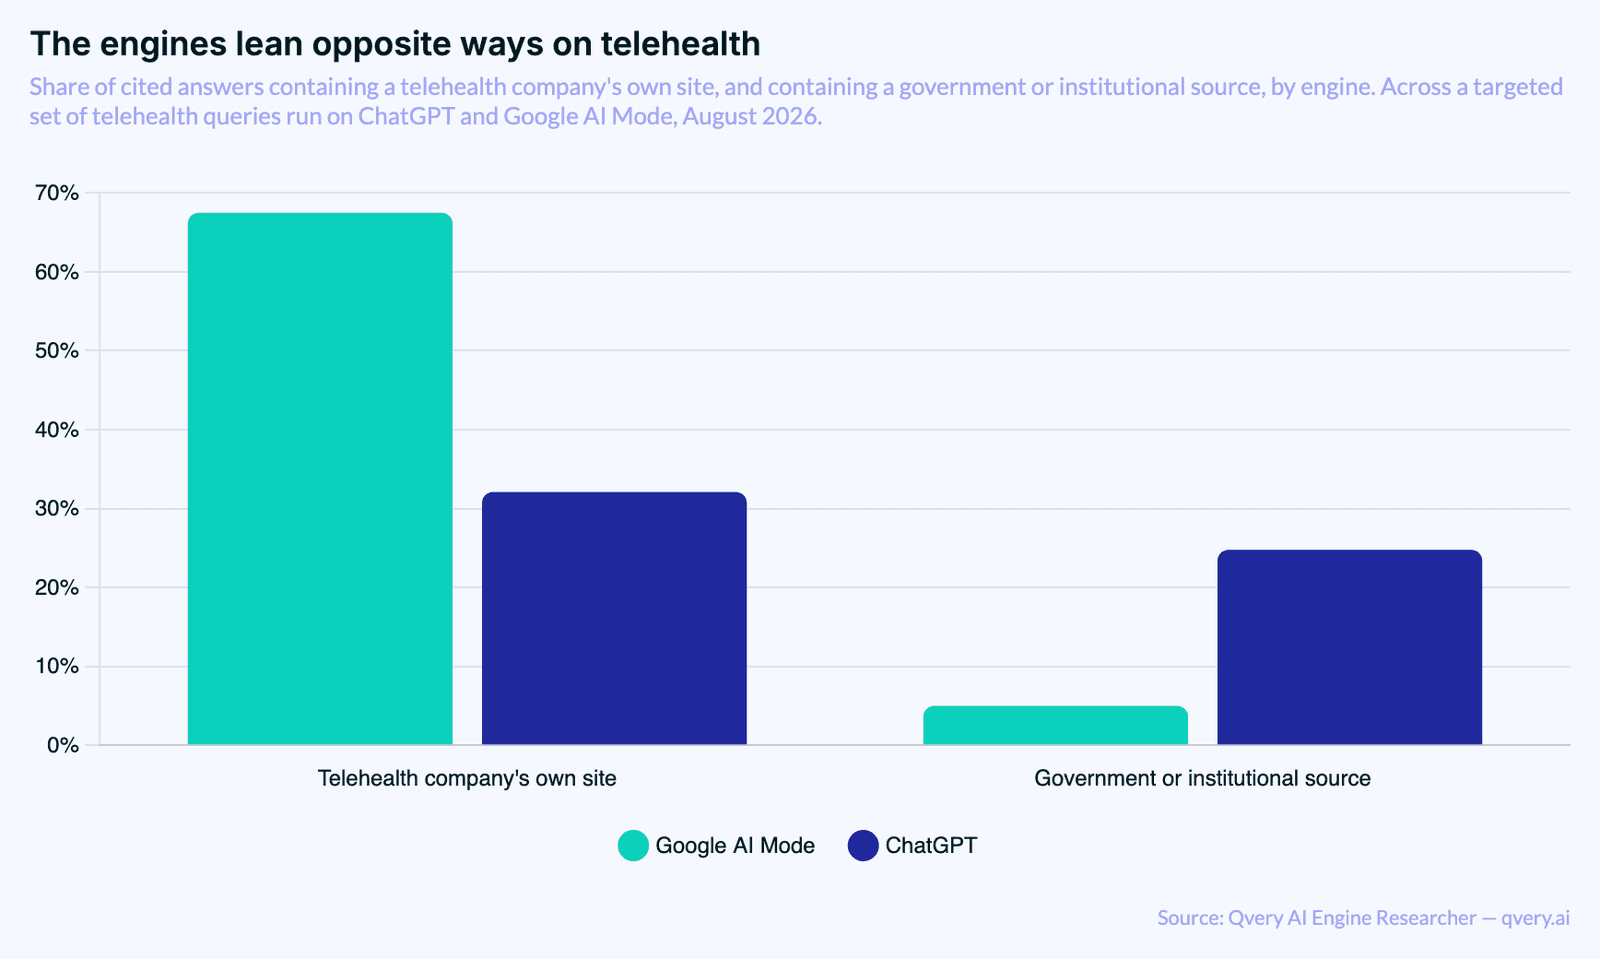
A telehealth company's own website appears in 67.50% of cited Google AI Mode answers against 32.11% of cited ChatGPT ones.
The hypothesis held. What we had not predicted is the mirror image sitting next to it.
The Institutional Layer Runs The Other Way
Government and institutional sources appear in 24.79% of cited ChatGPT answers and 5.00% of cited Google AI Mode ones.
So the difference between the engines here is compositional rather than a matter of one being more cautious. Provider sites run 67.50% against 32.11%; institutional sources run 24.79% against 5.00%.
In this category the engines disagree about what a trustworthy source is, and they disagree in opposite directions.
For a telehealth brand this is the operative fact. On one engine your own site is the most likely thing to appear alongside the answer. On the other, you are competing with a federal health agency for the same slot.
Both arms cleared the sample floor we set for calling an engine difference real, and both ratios cleared the size threshold we require before reporting one.
Worth being precise about what a registered prediction buys you here. We could have run this collection, seen the provider gap, and written it up as a discovery. Writing the threshold down first means the result is a test rather than a pattern we noticed afterwards, and it means we would have published the null just as readily.
The institutional finding does not have that status. We did not predict it, so it is a genuine observation from this collection and should be treated as more provisional than the provider result until someone re-runs it.
What Sits In The Answers Overall
Pooled across both engines, the leading individual sources look like this.
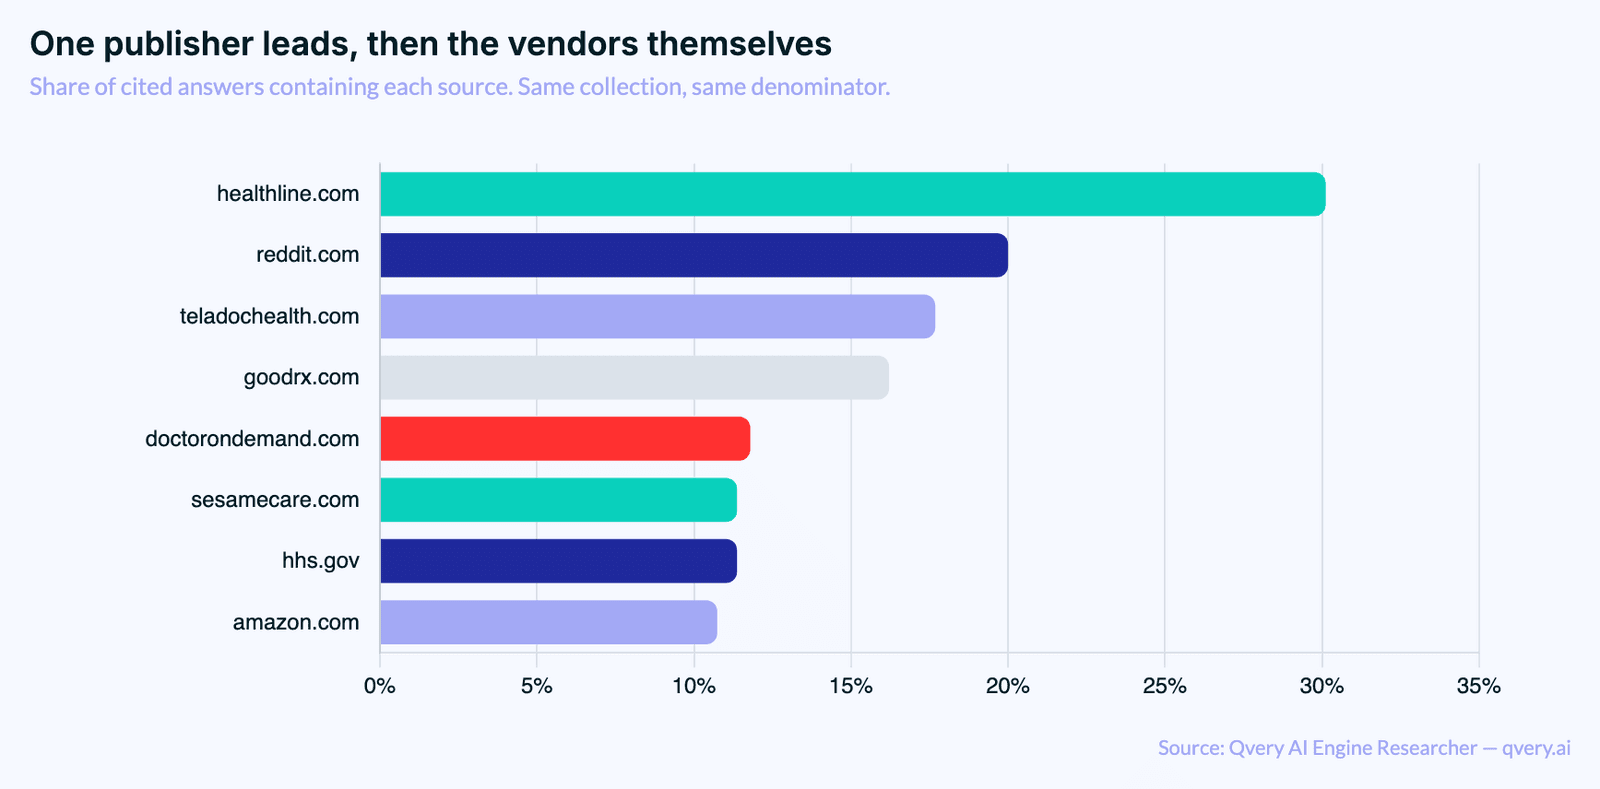
Healthline leads at 30.11%. Reddit follows at 20.00%. Then come the providers themselves: Teladoc at 17.68%, GoodRx at 16.21%, Doctor On Demand at 11.79%, Sesame at 11.37%.
Taken together, a telehealth company's own site appears in 41.05% of cited answers across both engines. That is a category where owned content reaches four in ten answers, which is not true everywhere. In an automotive collection we ran separately, manufacturers' own channels were effectively absent from their own category.
The provider and institutional groupings above are hand-checked named lists, not classifier output. We attempted automated source classification three times in this research and it failed independent validation each time, so any category we publish now is a short list of unambiguous sites we read individually.
Where The Question Type Matters
Cost and access questions, the ones that mention insurance, price, or same-day availability, showed the highest provider-site presence of any query family we ran.
Weight and GLP-1 questions ran the other way, with the lowest provider presence and among the highest institutional presence in the collection.
We are putting no percentages on the individual condition areas. Four of the six query families fall below the minimum arm size we set before collection for publishing a share, so those stay directional. The registered design anticipated this and specified that individual condition slices ship as qualitative colour only.
Stated as an association in this US-weighted query set and nothing more: provider-site presence was highest in the cost and access arm and lowest in the weight and GLP-1 arm, with institutional presence running the other way.
Running This On Your Own Category
Everything above is one collection at one moment. Four things follow, offered as the writer's judgment rather than as results. None is established by the collection.
Split by engine before anything else. With provider presence at 67.50% against 32.11% and institutional presence at 5.00% against 24.79%, a pooled report averages two opposite pictures.
Separate cost and access questions from clinical ones. They behaved differently here, and they are usually owned by different teams anyway.
Track your own domain as a cited source. In this category owned content reaches four in ten answers, which makes your own site a measurable participant rather than only a destination.
Log it over time. A single snapshot cannot distinguish a source that structurally anchors your category from one that appeared once.
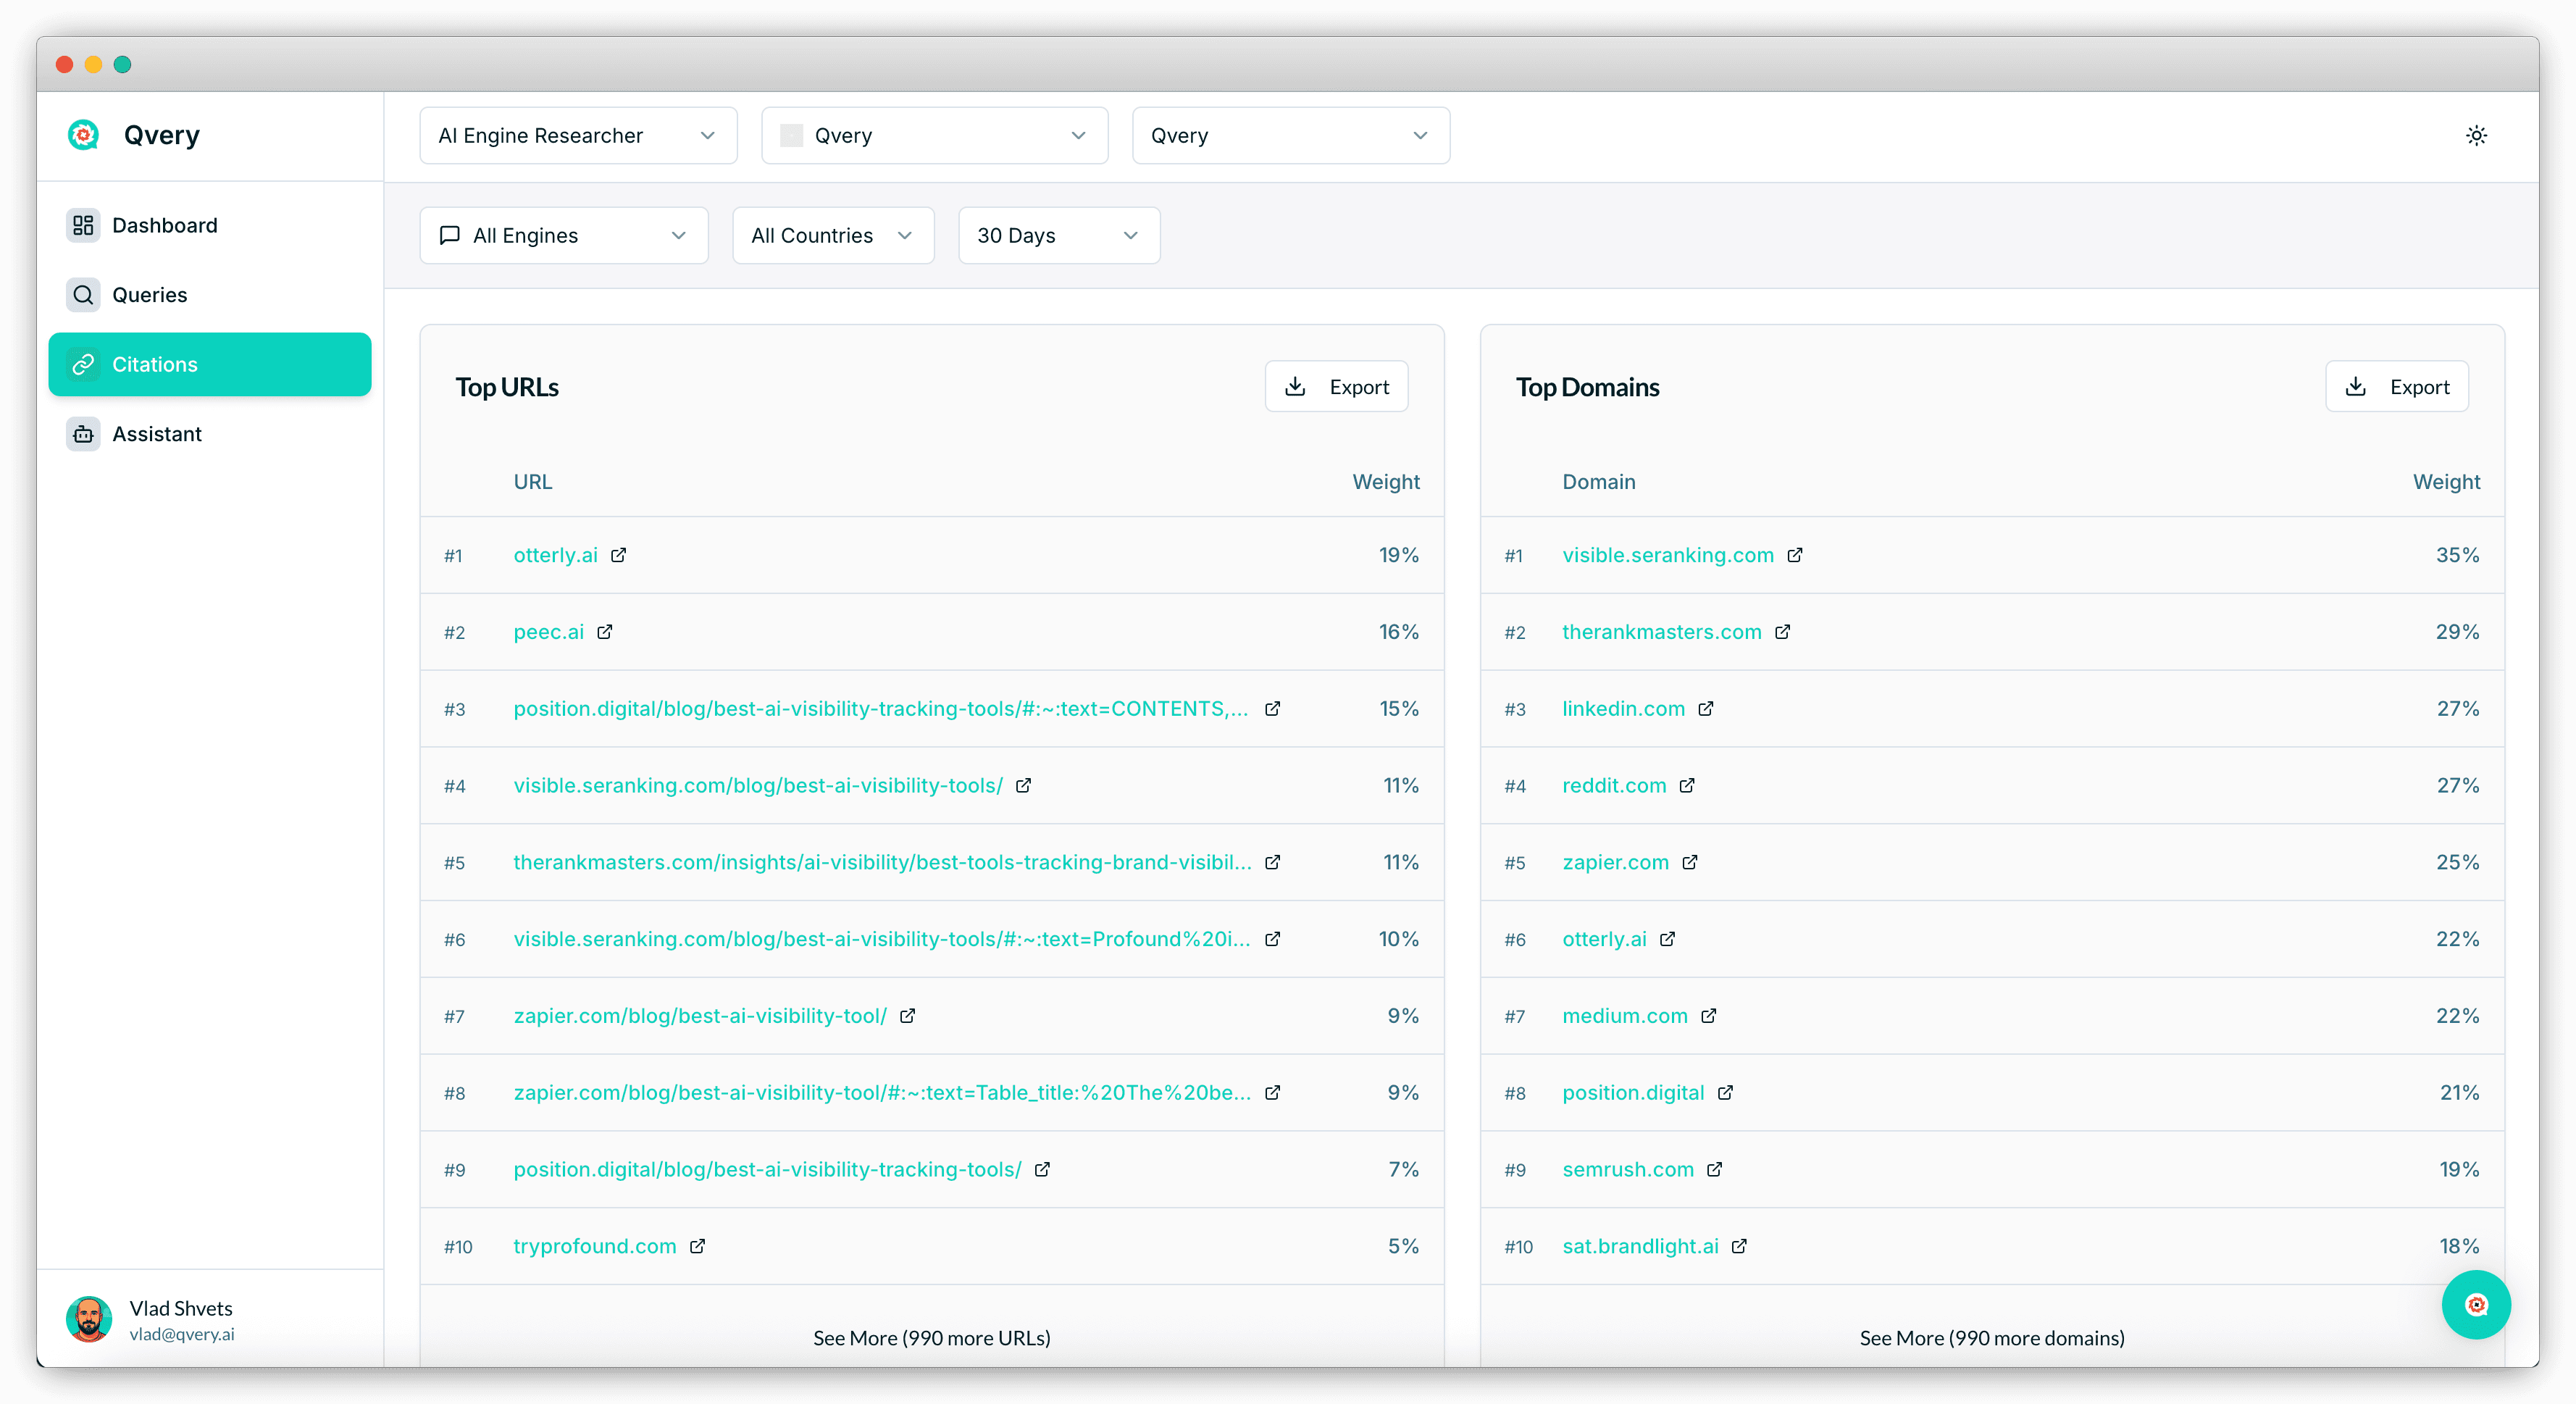
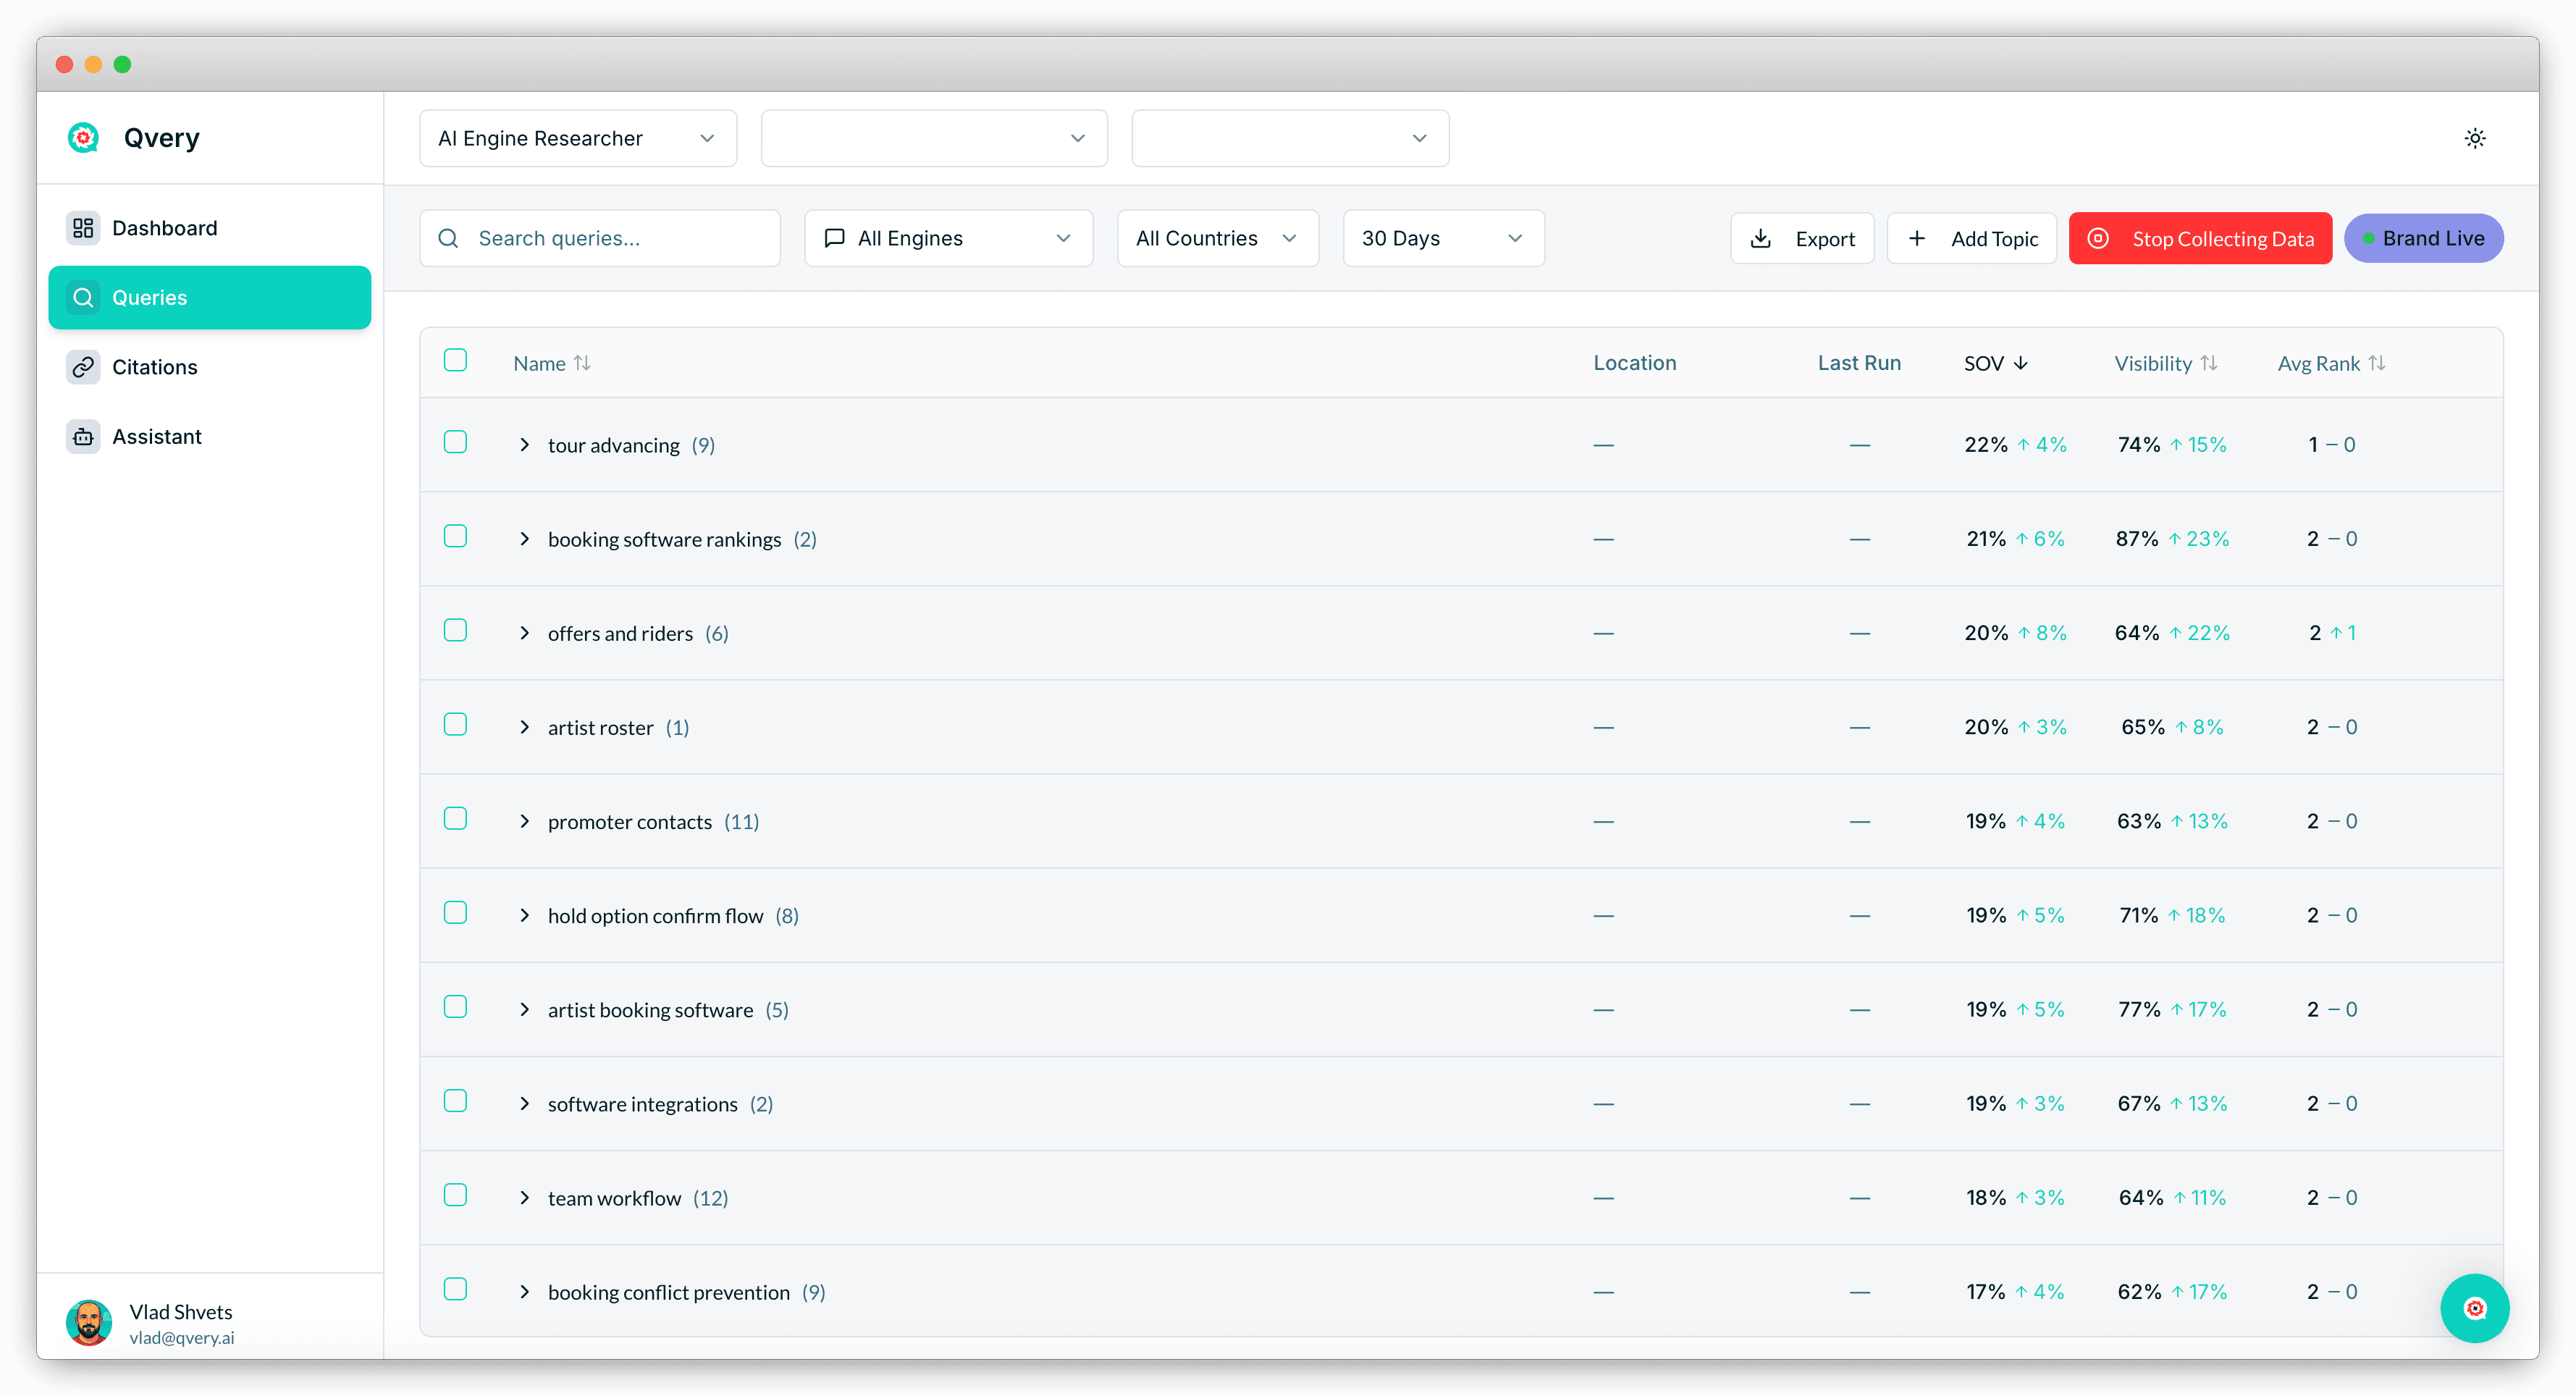
Qvery supplies the tracking underneath that. It tracks visibility, share of voice, and average rank across ChatGPT and Google AI Mode daily, in over 200 countries, and captures every citation tied to the query and engine that produced it. In Qvery Assistant you can ask about your own visibility, share of voice, citation, topic, and query data, add queries, trigger a run, or export a report.
Start your free trial and split your first month of telehealth citations by engine.
Writer's Judgment, Not A Finding
Flagging this clearly, because the rest of the article stays inside what was measured.
Given provider sites at 67.50% on one engine and institutional sources at 24.79% on the other, our judgment is that a telehealth brand needs two different content postures rather than one. Clinical accuracy and citable structure matter most where the institutional layer is strong. Clear commercial pages matter most where provider sites are already appearing.
That is a view about where effort is likely to pay. The collection does not establish it.
What the collection did establish is narrower and firmer. A provider's own site appears in 67.50% of cited Google AI Mode answers against 32.11% of ChatGPT's, a 2.10 times ratio that confirmed a hypothesis registered before collection.
Government and institutional sources run the opposite way, at 24.79% against 5.00%, and Healthline leads all individual sources at 30.11%.
Those are the bounds. What you do inside them is a decision, not a finding.
Telehealth sits in the category AI engines are most careful about. Health questions attract caution, and the usual assumption is that both engines fall back on institutional sources when the topic gets medical.
Half of that assumption held up. The other half turned out to be an engine-specific behaviour, and it points the two engines in opposite directions.
One boundary before any number. This measures which sources appear alongside the answers. It does not measure whether appearing on a source causes a provider to be recommended, and nothing here was designed to test that.
A Prediction We Wrote Down Before Collecting
Before running anything, we registered a specific hypothesis: that Google AI Mode's telehealth answers would cite providers' own websites at least 1.5 times as often as ChatGPT's.
We wrote down what would falsify it too. Below 1.5 times and the hypothesis dies, published either way.
Across a targeted set of telehealth queries spanning general virtual care, four condition areas, and cost and access questions, run on ChatGPT and Google AI Mode, August 2026, the ratio came in at 2.10 times.
A telehealth company's own website appears in 67.50% of cited Google AI Mode answers against 32.11% of cited ChatGPT ones.
The hypothesis held. What we had not predicted is the mirror image sitting next to it.
The Institutional Layer Runs The Other Way
Government and institutional sources appear in 24.79% of cited ChatGPT answers and 5.00% of cited Google AI Mode ones.
So the difference between the engines here is compositional rather than a matter of one being more cautious. Provider sites run 67.50% against 32.11%; institutional sources run 24.79% against 5.00%.
In this category the engines disagree about what a trustworthy source is, and they disagree in opposite directions.
For a telehealth brand this is the operative fact. On one engine your own site is the most likely thing to appear alongside the answer. On the other, you are competing with a federal health agency for the same slot.
Both arms cleared the sample floor we set for calling an engine difference real, and both ratios cleared the size threshold we require before reporting one.
Worth being precise about what a registered prediction buys you here. We could have run this collection, seen the provider gap, and written it up as a discovery. Writing the threshold down first means the result is a test rather than a pattern we noticed afterwards, and it means we would have published the null just as readily.
The institutional finding does not have that status. We did not predict it, so it is a genuine observation from this collection and should be treated as more provisional than the provider result until someone re-runs it.
What Sits In The Answers Overall
Pooled across both engines, the leading individual sources look like this.
Healthline leads at 30.11%. Reddit follows at 20.00%. Then come the providers themselves: Teladoc at 17.68%, GoodRx at 16.21%, Doctor On Demand at 11.79%, Sesame at 11.37%.
Taken together, a telehealth company's own site appears in 41.05% of cited answers across both engines. That is a category where owned content reaches four in ten answers, which is not true everywhere. In an automotive collection we ran separately, manufacturers' own channels were effectively absent from their own category.
The provider and institutional groupings above are hand-checked named lists, not classifier output. We attempted automated source classification three times in this research and it failed independent validation each time, so any category we publish now is a short list of unambiguous sites we read individually.
Where The Question Type Matters
Cost and access questions, the ones that mention insurance, price, or same-day availability, showed the highest provider-site presence of any query family we ran.
Weight and GLP-1 questions ran the other way, with the lowest provider presence and among the highest institutional presence in the collection.
We are putting no percentages on the individual condition areas. Four of the six query families fall below the minimum arm size we set before collection for publishing a share, so those stay directional. The registered design anticipated this and specified that individual condition slices ship as qualitative colour only.
Stated as an association in this US-weighted query set and nothing more: provider-site presence was highest in the cost and access arm and lowest in the weight and GLP-1 arm, with institutional presence running the other way.
Running This On Your Own Category
Everything above is one collection at one moment. Four things follow, offered as the writer's judgment rather than as results. None is established by the collection.
Split by engine before anything else. With provider presence at 67.50% against 32.11% and institutional presence at 5.00% against 24.79%, a pooled report averages two opposite pictures.
Separate cost and access questions from clinical ones. They behaved differently here, and they are usually owned by different teams anyway.
Track your own domain as a cited source. In this category owned content reaches four in ten answers, which makes your own site a measurable participant rather than only a destination.
Log it over time. A single snapshot cannot distinguish a source that structurally anchors your category from one that appeared once.
Qvery supplies the tracking underneath that. It tracks visibility, share of voice, and average rank across ChatGPT and Google AI Mode daily, in over 200 countries, and captures every citation tied to the query and engine that produced it. In Qvery Assistant you can ask about your own visibility, share of voice, citation, topic, and query data, add queries, trigger a run, or export a report.
Start your free trial and split your first month of telehealth citations by engine.
Writer's Judgment, Not A Finding
Flagging this clearly, because the rest of the article stays inside what was measured.
Given provider sites at 67.50% on one engine and institutional sources at 24.79% on the other, our judgment is that a telehealth brand needs two different content postures rather than one. Clinical accuracy and citable structure matter most where the institutional layer is strong. Clear commercial pages matter most where provider sites are already appearing.
That is a view about where effort is likely to pay. The collection does not establish it.
What the collection did establish is narrower and firmer. A provider's own site appears in 67.50% of cited Google AI Mode answers against 32.11% of ChatGPT's, a 2.10 times ratio that confirmed a hypothesis registered before collection.
Government and institutional sources run the opposite way, at 24.79% against 5.00%, and Healthline leads all individual sources at 30.11%.
Those are the bounds. What you do inside them is a decision, not a finding.
Telehealth sits in the category AI engines are most careful about. Health questions attract caution, and the usual assumption is that both engines fall back on institutional sources when the topic gets medical.
Half of that assumption held up. The other half turned out to be an engine-specific behaviour, and it points the two engines in opposite directions.
One boundary before any number. This measures which sources appear alongside the answers. It does not measure whether appearing on a source causes a provider to be recommended, and nothing here was designed to test that.
A Prediction We Wrote Down Before Collecting
Before running anything, we registered a specific hypothesis: that Google AI Mode's telehealth answers would cite providers' own websites at least 1.5 times as often as ChatGPT's.
We wrote down what would falsify it too. Below 1.5 times and the hypothesis dies, published either way.
Across a targeted set of telehealth queries spanning general virtual care, four condition areas, and cost and access questions, run on ChatGPT and Google AI Mode, August 2026, the ratio came in at 2.10 times.
A telehealth company's own website appears in 67.50% of cited Google AI Mode answers against 32.11% of cited ChatGPT ones.
The hypothesis held. What we had not predicted is the mirror image sitting next to it.
The Institutional Layer Runs The Other Way
Government and institutional sources appear in 24.79% of cited ChatGPT answers and 5.00% of cited Google AI Mode ones.
So the difference between the engines here is compositional rather than a matter of one being more cautious. Provider sites run 67.50% against 32.11%; institutional sources run 24.79% against 5.00%.
In this category the engines disagree about what a trustworthy source is, and they disagree in opposite directions.
For a telehealth brand this is the operative fact. On one engine your own site is the most likely thing to appear alongside the answer. On the other, you are competing with a federal health agency for the same slot.
Both arms cleared the sample floor we set for calling an engine difference real, and both ratios cleared the size threshold we require before reporting one.
Worth being precise about what a registered prediction buys you here. We could have run this collection, seen the provider gap, and written it up as a discovery. Writing the threshold down first means the result is a test rather than a pattern we noticed afterwards, and it means we would have published the null just as readily.
The institutional finding does not have that status. We did not predict it, so it is a genuine observation from this collection and should be treated as more provisional than the provider result until someone re-runs it.
What Sits In The Answers Overall
Pooled across both engines, the leading individual sources look like this.
Healthline leads at 30.11%. Reddit follows at 20.00%. Then come the providers themselves: Teladoc at 17.68%, GoodRx at 16.21%, Doctor On Demand at 11.79%, Sesame at 11.37%.
Taken together, a telehealth company's own site appears in 41.05% of cited answers across both engines. That is a category where owned content reaches four in ten answers, which is not true everywhere. In an automotive collection we ran separately, manufacturers' own channels were effectively absent from their own category.
The provider and institutional groupings above are hand-checked named lists, not classifier output. We attempted automated source classification three times in this research and it failed independent validation each time, so any category we publish now is a short list of unambiguous sites we read individually.
Where The Question Type Matters
Cost and access questions, the ones that mention insurance, price, or same-day availability, showed the highest provider-site presence of any query family we ran.
Weight and GLP-1 questions ran the other way, with the lowest provider presence and among the highest institutional presence in the collection.
We are putting no percentages on the individual condition areas. Four of the six query families fall below the minimum arm size we set before collection for publishing a share, so those stay directional. The registered design anticipated this and specified that individual condition slices ship as qualitative colour only.
Stated as an association in this US-weighted query set and nothing more: provider-site presence was highest in the cost and access arm and lowest in the weight and GLP-1 arm, with institutional presence running the other way.
Running This On Your Own Category
Everything above is one collection at one moment. Four things follow, offered as the writer's judgment rather than as results. None is established by the collection.
Split by engine before anything else. With provider presence at 67.50% against 32.11% and institutional presence at 5.00% against 24.79%, a pooled report averages two opposite pictures.
Separate cost and access questions from clinical ones. They behaved differently here, and they are usually owned by different teams anyway.
Track your own domain as a cited source. In this category owned content reaches four in ten answers, which makes your own site a measurable participant rather than only a destination.
Log it over time. A single snapshot cannot distinguish a source that structurally anchors your category from one that appeared once.
Qvery supplies the tracking underneath that. It tracks visibility, share of voice, and average rank across ChatGPT and Google AI Mode daily, in over 200 countries, and captures every citation tied to the query and engine that produced it. In Qvery Assistant you can ask about your own visibility, share of voice, citation, topic, and query data, add queries, trigger a run, or export a report.
Start your free trial and split your first month of telehealth citations by engine.
Writer's Judgment, Not A Finding
Flagging this clearly, because the rest of the article stays inside what was measured.
Given provider sites at 67.50% on one engine and institutional sources at 24.79% on the other, our judgment is that a telehealth brand needs two different content postures rather than one. Clinical accuracy and citable structure matter most where the institutional layer is strong. Clear commercial pages matter most where provider sites are already appearing.
That is a view about where effort is likely to pay. The collection does not establish it.
What the collection did establish is narrower and firmer. A provider's own site appears in 67.50% of cited Google AI Mode answers against 32.11% of ChatGPT's, a 2.10 times ratio that confirmed a hypothesis registered before collection.
Government and institutional sources run the opposite way, at 24.79% against 5.00%, and Healthline leads all individual sources at 30.11%.
Those are the bounds. What you do inside them is a decision, not a finding.
Telehealth sits in the category AI engines are most careful about. Health questions attract caution, and the usual assumption is that both engines fall back on institutional sources when the topic gets medical.
Half of that assumption held up. The other half turned out to be an engine-specific behaviour, and it points the two engines in opposite directions.
One boundary before any number. This measures which sources appear alongside the answers. It does not measure whether appearing on a source causes a provider to be recommended, and nothing here was designed to test that.
A Prediction We Wrote Down Before Collecting
Before running anything, we registered a specific hypothesis: that Google AI Mode's telehealth answers would cite providers' own websites at least 1.5 times as often as ChatGPT's.
We wrote down what would falsify it too. Below 1.5 times and the hypothesis dies, published either way.
Across a targeted set of telehealth queries spanning general virtual care, four condition areas, and cost and access questions, run on ChatGPT and Google AI Mode, August 2026, the ratio came in at 2.10 times.
A telehealth company's own website appears in 67.50% of cited Google AI Mode answers against 32.11% of cited ChatGPT ones.
The hypothesis held. What we had not predicted is the mirror image sitting next to it.
The Institutional Layer Runs The Other Way
Government and institutional sources appear in 24.79% of cited ChatGPT answers and 5.00% of cited Google AI Mode ones.
So the difference between the engines here is compositional rather than a matter of one being more cautious. Provider sites run 67.50% against 32.11%; institutional sources run 24.79% against 5.00%.
In this category the engines disagree about what a trustworthy source is, and they disagree in opposite directions.
For a telehealth brand this is the operative fact. On one engine your own site is the most likely thing to appear alongside the answer. On the other, you are competing with a federal health agency for the same slot.
Both arms cleared the sample floor we set for calling an engine difference real, and both ratios cleared the size threshold we require before reporting one.
Worth being precise about what a registered prediction buys you here. We could have run this collection, seen the provider gap, and written it up as a discovery. Writing the threshold down first means the result is a test rather than a pattern we noticed afterwards, and it means we would have published the null just as readily.
The institutional finding does not have that status. We did not predict it, so it is a genuine observation from this collection and should be treated as more provisional than the provider result until someone re-runs it.
What Sits In The Answers Overall
Pooled across both engines, the leading individual sources look like this.
Healthline leads at 30.11%. Reddit follows at 20.00%. Then come the providers themselves: Teladoc at 17.68%, GoodRx at 16.21%, Doctor On Demand at 11.79%, Sesame at 11.37%.
Taken together, a telehealth company's own site appears in 41.05% of cited answers across both engines. That is a category where owned content reaches four in ten answers, which is not true everywhere. In an automotive collection we ran separately, manufacturers' own channels were effectively absent from their own category.
The provider and institutional groupings above are hand-checked named lists, not classifier output. We attempted automated source classification three times in this research and it failed independent validation each time, so any category we publish now is a short list of unambiguous sites we read individually.
Where The Question Type Matters
Cost and access questions, the ones that mention insurance, price, or same-day availability, showed the highest provider-site presence of any query family we ran.
Weight and GLP-1 questions ran the other way, with the lowest provider presence and among the highest institutional presence in the collection.
We are putting no percentages on the individual condition areas. Four of the six query families fall below the minimum arm size we set before collection for publishing a share, so those stay directional. The registered design anticipated this and specified that individual condition slices ship as qualitative colour only.
Stated as an association in this US-weighted query set and nothing more: provider-site presence was highest in the cost and access arm and lowest in the weight and GLP-1 arm, with institutional presence running the other way.
Running This On Your Own Category
Everything above is one collection at one moment. Four things follow, offered as the writer's judgment rather than as results. None is established by the collection.
Split by engine before anything else. With provider presence at 67.50% against 32.11% and institutional presence at 5.00% against 24.79%, a pooled report averages two opposite pictures.
Separate cost and access questions from clinical ones. They behaved differently here, and they are usually owned by different teams anyway.
Track your own domain as a cited source. In this category owned content reaches four in ten answers, which makes your own site a measurable participant rather than only a destination.
Log it over time. A single snapshot cannot distinguish a source that structurally anchors your category from one that appeared once.
Qvery supplies the tracking underneath that. It tracks visibility, share of voice, and average rank across ChatGPT and Google AI Mode daily, in over 200 countries, and captures every citation tied to the query and engine that produced it. In Qvery Assistant you can ask about your own visibility, share of voice, citation, topic, and query data, add queries, trigger a run, or export a report.
Start your free trial and split your first month of telehealth citations by engine.
Writer's Judgment, Not A Finding
Flagging this clearly, because the rest of the article stays inside what was measured.
Given provider sites at 67.50% on one engine and institutional sources at 24.79% on the other, our judgment is that a telehealth brand needs two different content postures rather than one. Clinical accuracy and citable structure matter most where the institutional layer is strong. Clear commercial pages matter most where provider sites are already appearing.
That is a view about where effort is likely to pay. The collection does not establish it.
What the collection did establish is narrower and firmer. A provider's own site appears in 67.50% of cited Google AI Mode answers against 32.11% of ChatGPT's, a 2.10 times ratio that confirmed a hypothesis registered before collection.
Government and institutional sources run the opposite way, at 24.79% against 5.00%, and Healthline leads all individual sources at 30.11%.
Those are the bounds. What you do inside them is a decision, not a finding.

© 2026 Qvery AI OÜ