By
Vlad Shvets
How to Measure Your Law Firm's AI Visibility: Share of Voice by Practice Area and City
The two practice areas we measured share almost none of their cited sources. A single blended visibility number describes neither. How to structure law-firm tracking queries the way clients ask, and read share of voice per market in Qvery.
The two practice areas we measured share almost none of their cited sources. A single blended visibility number describes neither. How to structure law-firm tracking queries the way clients ask, and read share of voice per market in Qvery.
The two practice areas we measured share almost none of their cited sources. A single blended visibility number describes neither. How to structure law-firm tracking queries the way clients ask, and read share of voice per market in Qvery.
Most law firms that measure AI visibility at all measure one number: how often does the firm's name come up. One number, all practice areas, all markets, checked whenever someone remembers. It reads like a report and answers nothing a managing partner can act on.
We measured why the single number fails. Same collection, same engines, two city-anchored question sets: people looking for a personal-injury lawyer and people dealing with a landlord-tenant problem.
The short version: the two practice areas' answers are built from almost completely different sources, so a blended visibility number averages two worlds and describes neither. The fix is structural: measure share of voice per practice area, per market, on a schedule.
The scope note first: one month of answers; a planning signal, not a census.
Two Practice Areas, Two Different Source Worlds
Across a targeted set of city-anchored legal questions we ran on ChatGPT and Google AI Mode in August 2026 (US-weighted, with a UK, Canadian, and Australian mix), the two practice areas' leading source sets overlapped at 0.07 on a 0-to-1 scale. Not similar-but-different: near-disjoint.
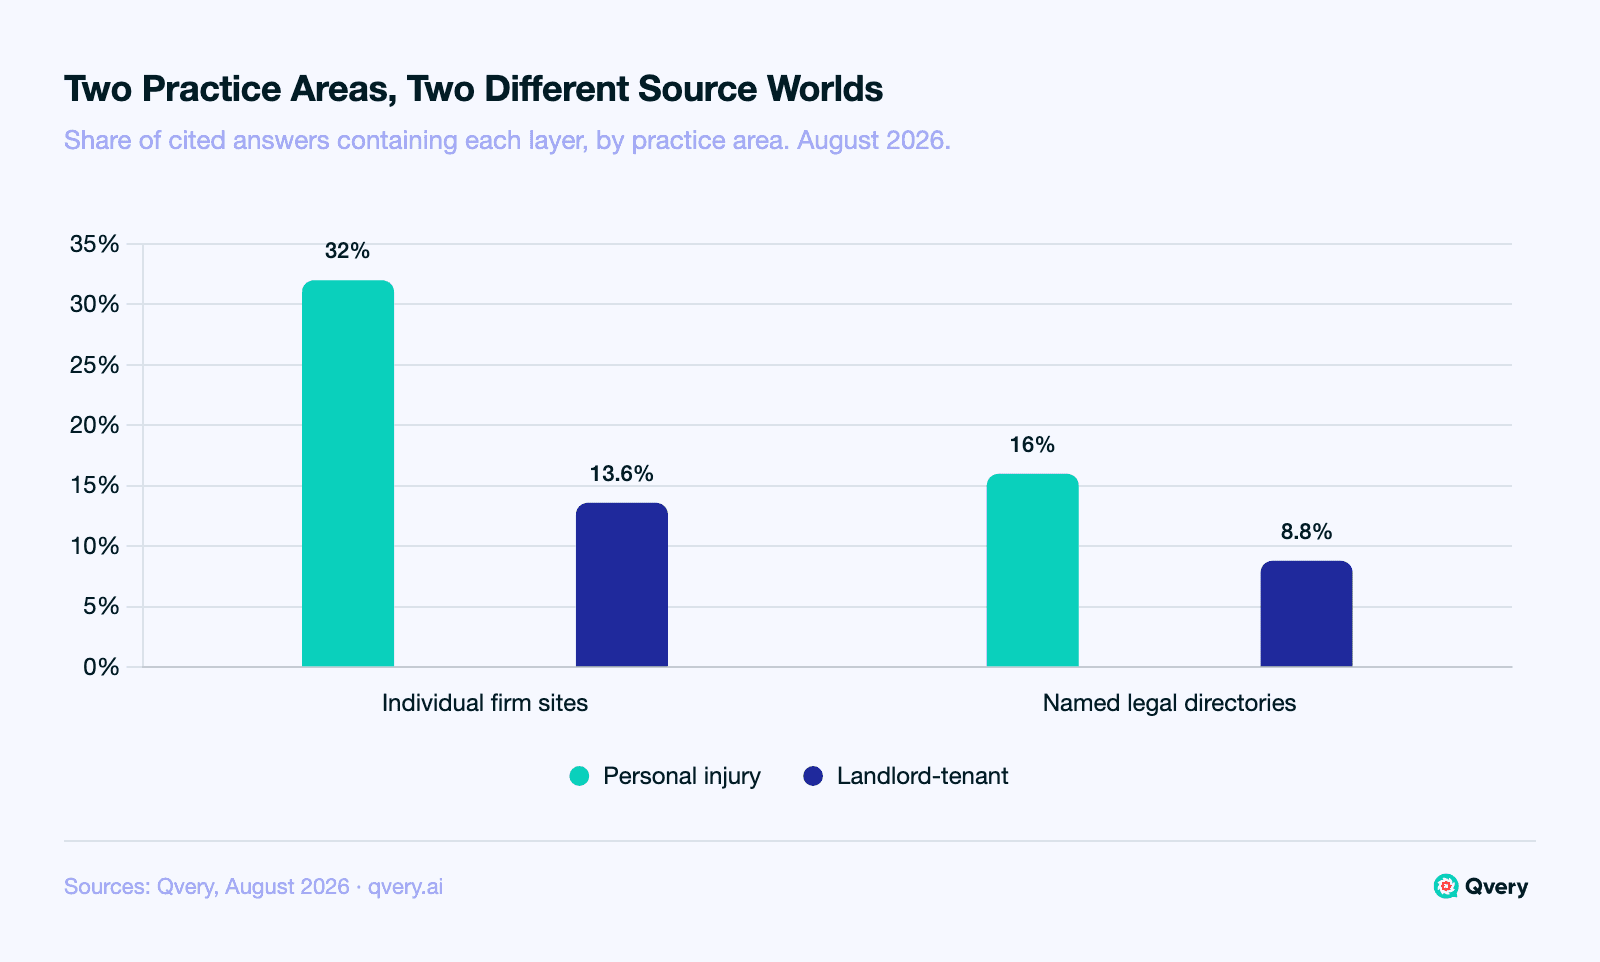
The personal-injury answers were built from the layer legal marketing knows: individual firm sites in 32.00% of the answers that cited any source, named legal directories in 16.00%, comparison sites around them.
The landlord-tenant answers came from somewhere else entirely: legal-aid and tenant-rights organizations in 12.80% of that side's cited answers (against 1.60% on the injury side), city and state government pages, housing charities. A read we had not set out to test, so treat the aid-layer number as direction; the disjointness itself is the registered result.
A visibility report that pools practice areas is averaging a directory fight and a public-law library into one number nobody competes in.
This is a different cut of the same category we measured in the law-firm recommendation data, where discovery and reputation questions already ran on different layers. Practice area splits the sources again.
Your Own Site Is a Minority Player in Both
The layer a firm controls tells the same segmentation story: an individual firm's own site was in 32.00% of the personal-injury answers that cited any source and 13.60% of the landlord-tenant ones. A minority in both, twice the presence where the money is, and never the majority the marketing budget assumes.
Directories, for the record: 16.00% and 8.80%. That gap looks like a story, but at this sample size we cannot call it a real difference, so we will not.
(One reading note: a large share of Google AI Mode's citations resolve to Google's own domain rather than an external source, so these reads lean on the ChatGPT side of the record.)
How to Structure the Measurement
What the disjointness means operationally, as our judgment on the pattern:
One topic per practice area per market. "Personal injury, Phoenix" and "landlord-tenant, Phoenix" are different competitions with different sources; measure them as different topics, never one blended number.
Write queries the way clients ask. "Best car accident lawyer in Phoenix", "landlord won't return my deposit Phoenix": city-anchored, plain-language, a handful per topic. The phrasing is the instrument.
Read share of voice inside the segment. Your name against the firms competing in that practice area and city, not against the whole bar.
Put it on a schedule. A one-off check is a snapshot of a moving surface; the useful number is the trend line per segment.
Run the Practice-Area Grid in Qvery
This structure is exactly what Qvery is built to hold. At onboarding, Qvery generates topics and queries from your firm's profile; in the Assistant you shape them into the grid above in plain language: add the practice-area topics, add the city-anchored questions your clients type, delete what is not your market.
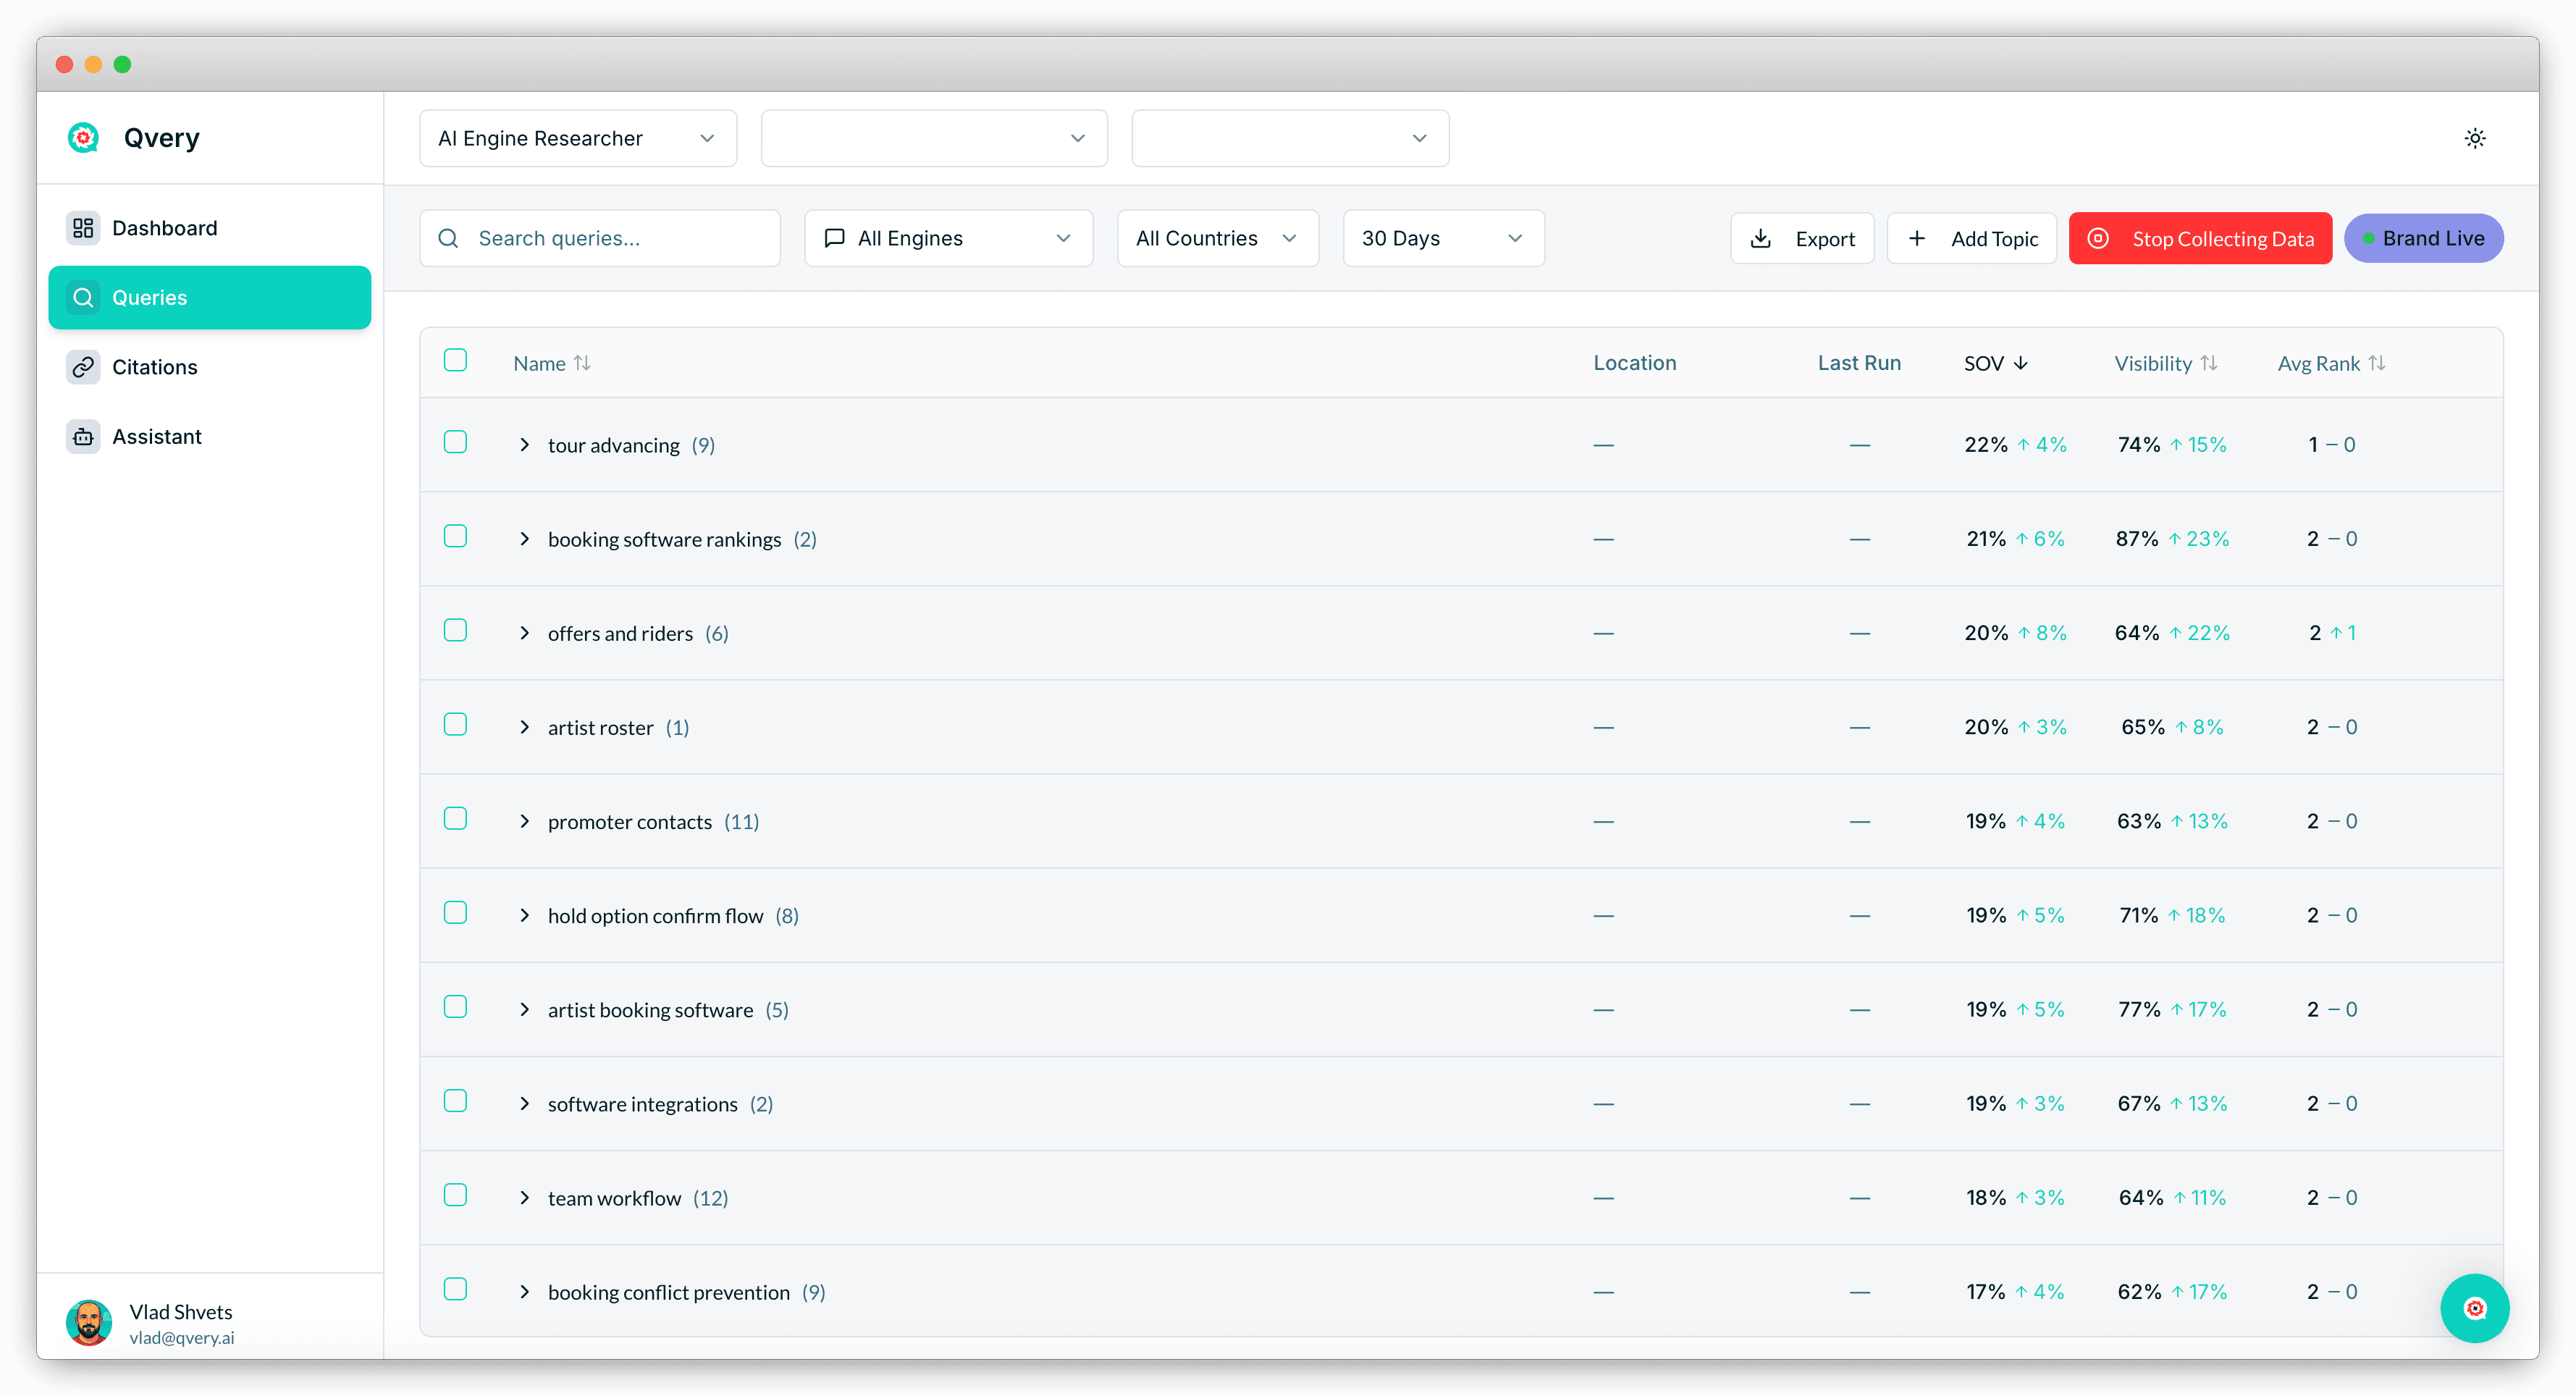
From there the grid runs daily on ChatGPT and Google AI Mode. Each topic carries its own share of voice, visibility, and average rank, per market, with every citation captured and tied to the query and engine that produced it, so when the landlord-tenant number moves you can open Citations and see which layer moved it.
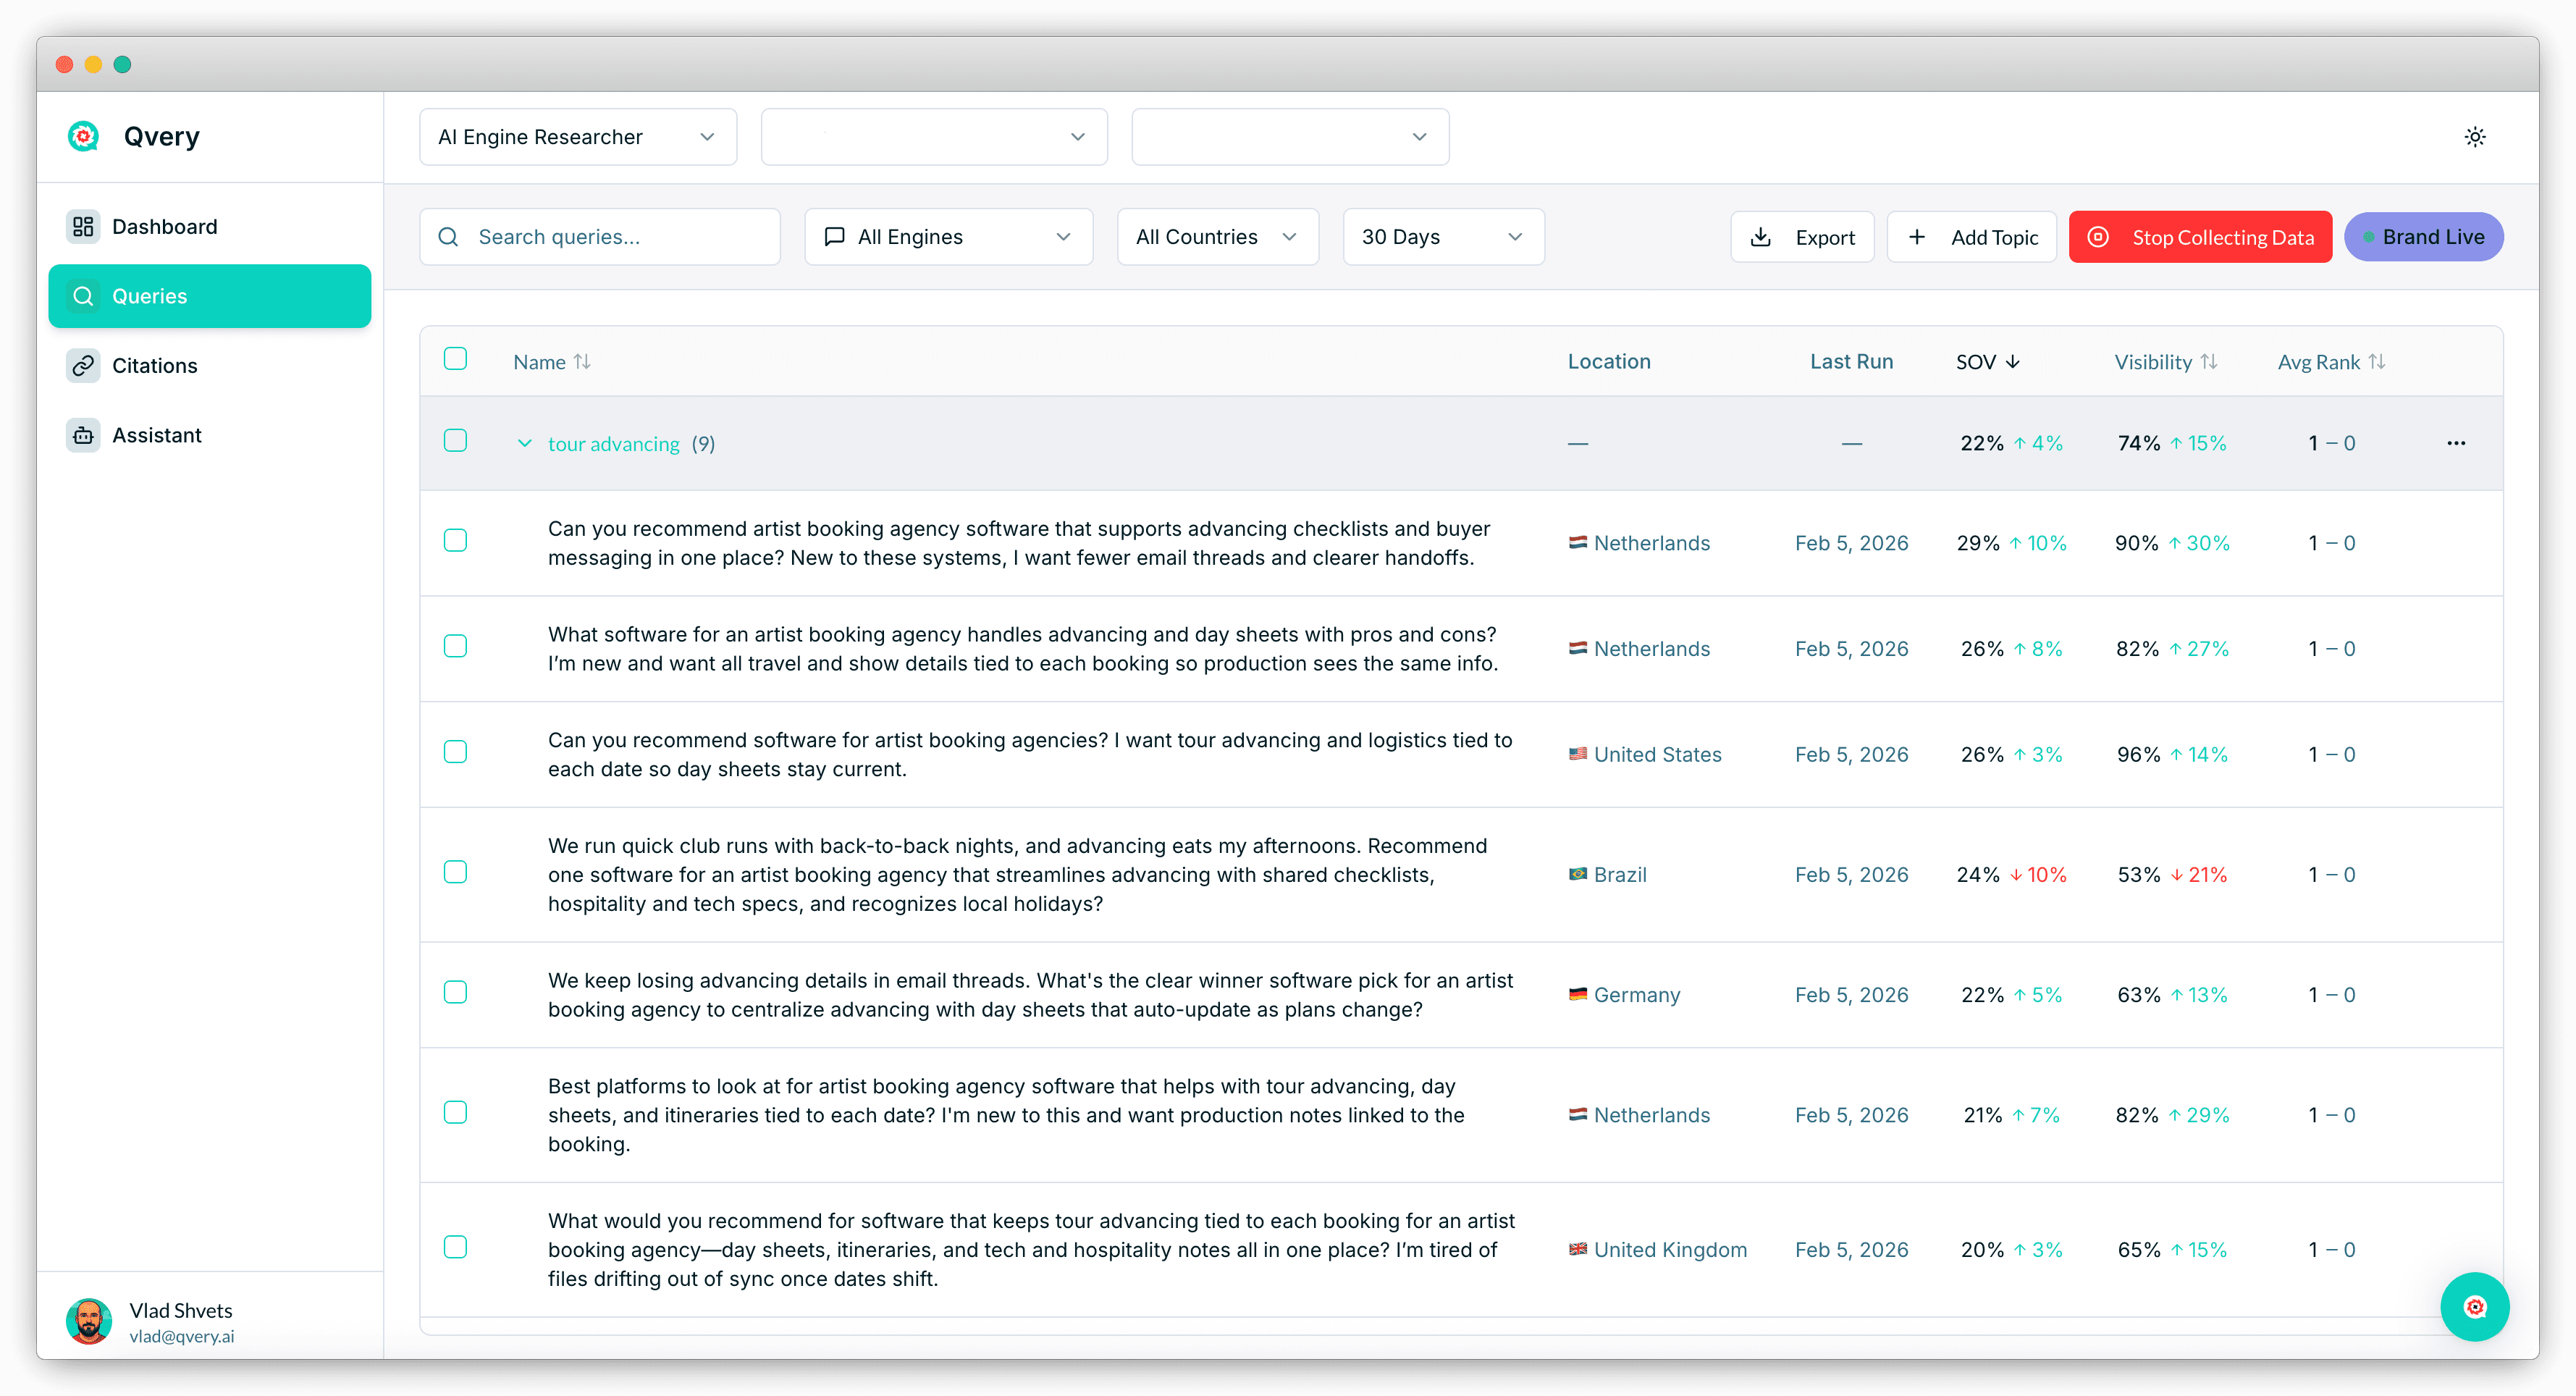
The practice-area labels and the competitive read stay yours; Qvery's job is the daily record that makes the per-segment trend real.
Sign up for Qvery, start the free 7-day trial, and have your first practice-area grid running before the next partner meeting asks how visible the firm is. This time there will be a real answer, per practice area, per city.
One move this week: pick your two biggest practice areas and run one client-phrased question for each through both engines yourself. If the two answers cite different worlds, you have just met the reason the blended number lies.
Most law firms that measure AI visibility at all measure one number: how often does the firm's name come up. One number, all practice areas, all markets, checked whenever someone remembers. It reads like a report and answers nothing a managing partner can act on.
We measured why the single number fails. Same collection, same engines, two city-anchored question sets: people looking for a personal-injury lawyer and people dealing with a landlord-tenant problem.
The short version: the two practice areas' answers are built from almost completely different sources, so a blended visibility number averages two worlds and describes neither. The fix is structural: measure share of voice per practice area, per market, on a schedule.
The scope note first: one month of answers; a planning signal, not a census.
Two Practice Areas, Two Different Source Worlds
Across a targeted set of city-anchored legal questions we ran on ChatGPT and Google AI Mode in August 2026 (US-weighted, with a UK, Canadian, and Australian mix), the two practice areas' leading source sets overlapped at 0.07 on a 0-to-1 scale. Not similar-but-different: near-disjoint.
The personal-injury answers were built from the layer legal marketing knows: individual firm sites in 32.00% of the answers that cited any source, named legal directories in 16.00%, comparison sites around them.
The landlord-tenant answers came from somewhere else entirely: legal-aid and tenant-rights organizations in 12.80% of that side's cited answers (against 1.60% on the injury side), city and state government pages, housing charities. A read we had not set out to test, so treat the aid-layer number as direction; the disjointness itself is the registered result.
A visibility report that pools practice areas is averaging a directory fight and a public-law library into one number nobody competes in.
This is a different cut of the same category we measured in the law-firm recommendation data, where discovery and reputation questions already ran on different layers. Practice area splits the sources again.
Your Own Site Is a Minority Player in Both
The layer a firm controls tells the same segmentation story: an individual firm's own site was in 32.00% of the personal-injury answers that cited any source and 13.60% of the landlord-tenant ones. A minority in both, twice the presence where the money is, and never the majority the marketing budget assumes.
Directories, for the record: 16.00% and 8.80%. That gap looks like a story, but at this sample size we cannot call it a real difference, so we will not.
(One reading note: a large share of Google AI Mode's citations resolve to Google's own domain rather than an external source, so these reads lean on the ChatGPT side of the record.)
How to Structure the Measurement
What the disjointness means operationally, as our judgment on the pattern:
One topic per practice area per market. "Personal injury, Phoenix" and "landlord-tenant, Phoenix" are different competitions with different sources; measure them as different topics, never one blended number.
Write queries the way clients ask. "Best car accident lawyer in Phoenix", "landlord won't return my deposit Phoenix": city-anchored, plain-language, a handful per topic. The phrasing is the instrument.
Read share of voice inside the segment. Your name against the firms competing in that practice area and city, not against the whole bar.
Put it on a schedule. A one-off check is a snapshot of a moving surface; the useful number is the trend line per segment.
Run the Practice-Area Grid in Qvery
This structure is exactly what Qvery is built to hold. At onboarding, Qvery generates topics and queries from your firm's profile; in the Assistant you shape them into the grid above in plain language: add the practice-area topics, add the city-anchored questions your clients type, delete what is not your market.
From there the grid runs daily on ChatGPT and Google AI Mode. Each topic carries its own share of voice, visibility, and average rank, per market, with every citation captured and tied to the query and engine that produced it, so when the landlord-tenant number moves you can open Citations and see which layer moved it.
The practice-area labels and the competitive read stay yours; Qvery's job is the daily record that makes the per-segment trend real.
Sign up for Qvery, start the free 7-day trial, and have your first practice-area grid running before the next partner meeting asks how visible the firm is. This time there will be a real answer, per practice area, per city.
One move this week: pick your two biggest practice areas and run one client-phrased question for each through both engines yourself. If the two answers cite different worlds, you have just met the reason the blended number lies.
Most law firms that measure AI visibility at all measure one number: how often does the firm's name come up. One number, all practice areas, all markets, checked whenever someone remembers. It reads like a report and answers nothing a managing partner can act on.
We measured why the single number fails. Same collection, same engines, two city-anchored question sets: people looking for a personal-injury lawyer and people dealing with a landlord-tenant problem.
The short version: the two practice areas' answers are built from almost completely different sources, so a blended visibility number averages two worlds and describes neither. The fix is structural: measure share of voice per practice area, per market, on a schedule.
The scope note first: one month of answers; a planning signal, not a census.
Two Practice Areas, Two Different Source Worlds
Across a targeted set of city-anchored legal questions we ran on ChatGPT and Google AI Mode in August 2026 (US-weighted, with a UK, Canadian, and Australian mix), the two practice areas' leading source sets overlapped at 0.07 on a 0-to-1 scale. Not similar-but-different: near-disjoint.
The personal-injury answers were built from the layer legal marketing knows: individual firm sites in 32.00% of the answers that cited any source, named legal directories in 16.00%, comparison sites around them.
The landlord-tenant answers came from somewhere else entirely: legal-aid and tenant-rights organizations in 12.80% of that side's cited answers (against 1.60% on the injury side), city and state government pages, housing charities. A read we had not set out to test, so treat the aid-layer number as direction; the disjointness itself is the registered result.
A visibility report that pools practice areas is averaging a directory fight and a public-law library into one number nobody competes in.
This is a different cut of the same category we measured in the law-firm recommendation data, where discovery and reputation questions already ran on different layers. Practice area splits the sources again.
Your Own Site Is a Minority Player in Both
The layer a firm controls tells the same segmentation story: an individual firm's own site was in 32.00% of the personal-injury answers that cited any source and 13.60% of the landlord-tenant ones. A minority in both, twice the presence where the money is, and never the majority the marketing budget assumes.
Directories, for the record: 16.00% and 8.80%. That gap looks like a story, but at this sample size we cannot call it a real difference, so we will not.
(One reading note: a large share of Google AI Mode's citations resolve to Google's own domain rather than an external source, so these reads lean on the ChatGPT side of the record.)
How to Structure the Measurement
What the disjointness means operationally, as our judgment on the pattern:
One topic per practice area per market. "Personal injury, Phoenix" and "landlord-tenant, Phoenix" are different competitions with different sources; measure them as different topics, never one blended number.
Write queries the way clients ask. "Best car accident lawyer in Phoenix", "landlord won't return my deposit Phoenix": city-anchored, plain-language, a handful per topic. The phrasing is the instrument.
Read share of voice inside the segment. Your name against the firms competing in that practice area and city, not against the whole bar.
Put it on a schedule. A one-off check is a snapshot of a moving surface; the useful number is the trend line per segment.
Run the Practice-Area Grid in Qvery
This structure is exactly what Qvery is built to hold. At onboarding, Qvery generates topics and queries from your firm's profile; in the Assistant you shape them into the grid above in plain language: add the practice-area topics, add the city-anchored questions your clients type, delete what is not your market.
From there the grid runs daily on ChatGPT and Google AI Mode. Each topic carries its own share of voice, visibility, and average rank, per market, with every citation captured and tied to the query and engine that produced it, so when the landlord-tenant number moves you can open Citations and see which layer moved it.
The practice-area labels and the competitive read stay yours; Qvery's job is the daily record that makes the per-segment trend real.
Sign up for Qvery, start the free 7-day trial, and have your first practice-area grid running before the next partner meeting asks how visible the firm is. This time there will be a real answer, per practice area, per city.
One move this week: pick your two biggest practice areas and run one client-phrased question for each through both engines yourself. If the two answers cite different worlds, you have just met the reason the blended number lies.
Most law firms that measure AI visibility at all measure one number: how often does the firm's name come up. One number, all practice areas, all markets, checked whenever someone remembers. It reads like a report and answers nothing a managing partner can act on.
We measured why the single number fails. Same collection, same engines, two city-anchored question sets: people looking for a personal-injury lawyer and people dealing with a landlord-tenant problem.
The short version: the two practice areas' answers are built from almost completely different sources, so a blended visibility number averages two worlds and describes neither. The fix is structural: measure share of voice per practice area, per market, on a schedule.
The scope note first: one month of answers; a planning signal, not a census.
Two Practice Areas, Two Different Source Worlds
Across a targeted set of city-anchored legal questions we ran on ChatGPT and Google AI Mode in August 2026 (US-weighted, with a UK, Canadian, and Australian mix), the two practice areas' leading source sets overlapped at 0.07 on a 0-to-1 scale. Not similar-but-different: near-disjoint.
The personal-injury answers were built from the layer legal marketing knows: individual firm sites in 32.00% of the answers that cited any source, named legal directories in 16.00%, comparison sites around them.
The landlord-tenant answers came from somewhere else entirely: legal-aid and tenant-rights organizations in 12.80% of that side's cited answers (against 1.60% on the injury side), city and state government pages, housing charities. A read we had not set out to test, so treat the aid-layer number as direction; the disjointness itself is the registered result.
A visibility report that pools practice areas is averaging a directory fight and a public-law library into one number nobody competes in.
This is a different cut of the same category we measured in the law-firm recommendation data, where discovery and reputation questions already ran on different layers. Practice area splits the sources again.
Your Own Site Is a Minority Player in Both
The layer a firm controls tells the same segmentation story: an individual firm's own site was in 32.00% of the personal-injury answers that cited any source and 13.60% of the landlord-tenant ones. A minority in both, twice the presence where the money is, and never the majority the marketing budget assumes.
Directories, for the record: 16.00% and 8.80%. That gap looks like a story, but at this sample size we cannot call it a real difference, so we will not.
(One reading note: a large share of Google AI Mode's citations resolve to Google's own domain rather than an external source, so these reads lean on the ChatGPT side of the record.)
How to Structure the Measurement
What the disjointness means operationally, as our judgment on the pattern:
One topic per practice area per market. "Personal injury, Phoenix" and "landlord-tenant, Phoenix" are different competitions with different sources; measure them as different topics, never one blended number.
Write queries the way clients ask. "Best car accident lawyer in Phoenix", "landlord won't return my deposit Phoenix": city-anchored, plain-language, a handful per topic. The phrasing is the instrument.
Read share of voice inside the segment. Your name against the firms competing in that practice area and city, not against the whole bar.
Put it on a schedule. A one-off check is a snapshot of a moving surface; the useful number is the trend line per segment.
Run the Practice-Area Grid in Qvery
This structure is exactly what Qvery is built to hold. At onboarding, Qvery generates topics and queries from your firm's profile; in the Assistant you shape them into the grid above in plain language: add the practice-area topics, add the city-anchored questions your clients type, delete what is not your market.
From there the grid runs daily on ChatGPT and Google AI Mode. Each topic carries its own share of voice, visibility, and average rank, per market, with every citation captured and tied to the query and engine that produced it, so when the landlord-tenant number moves you can open Citations and see which layer moved it.
The practice-area labels and the competitive read stay yours; Qvery's job is the daily record that makes the per-segment trend real.
Sign up for Qvery, start the free 7-day trial, and have your first practice-area grid running before the next partner meeting asks how visible the firm is. This time there will be a real answer, per practice area, per city.
One move this week: pick your two biggest practice areas and run one client-phrased question for each through both engines yourself. If the two answers cite different worlds, you have just met the reason the blended number lies.

© 2026 Qvery AI OÜ